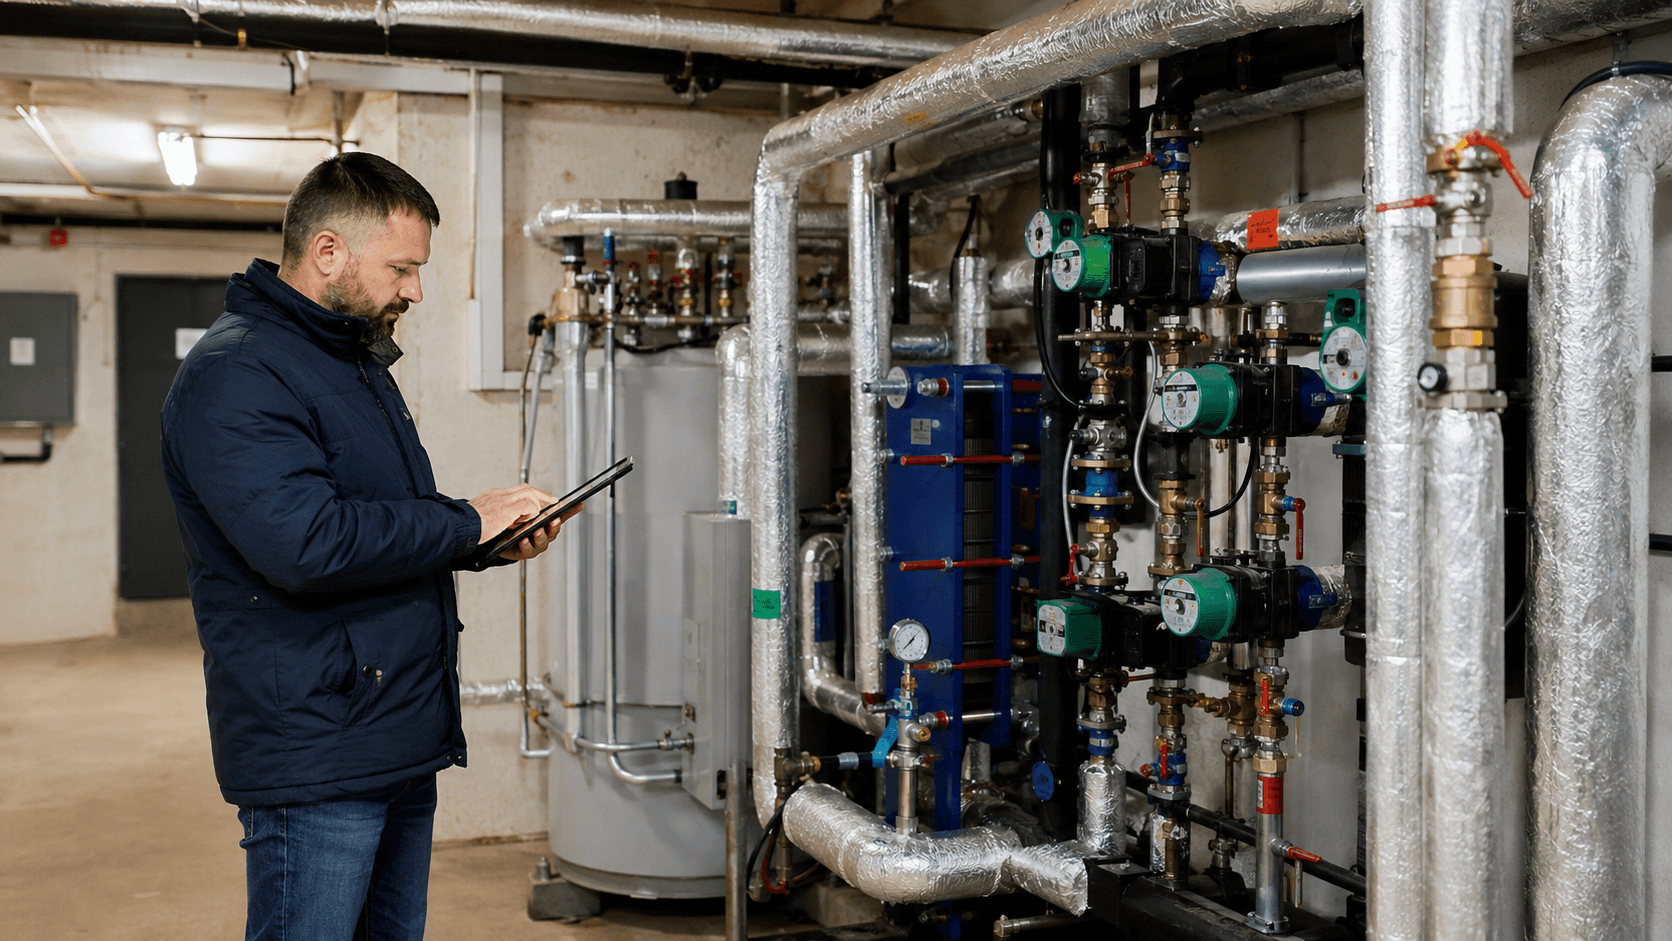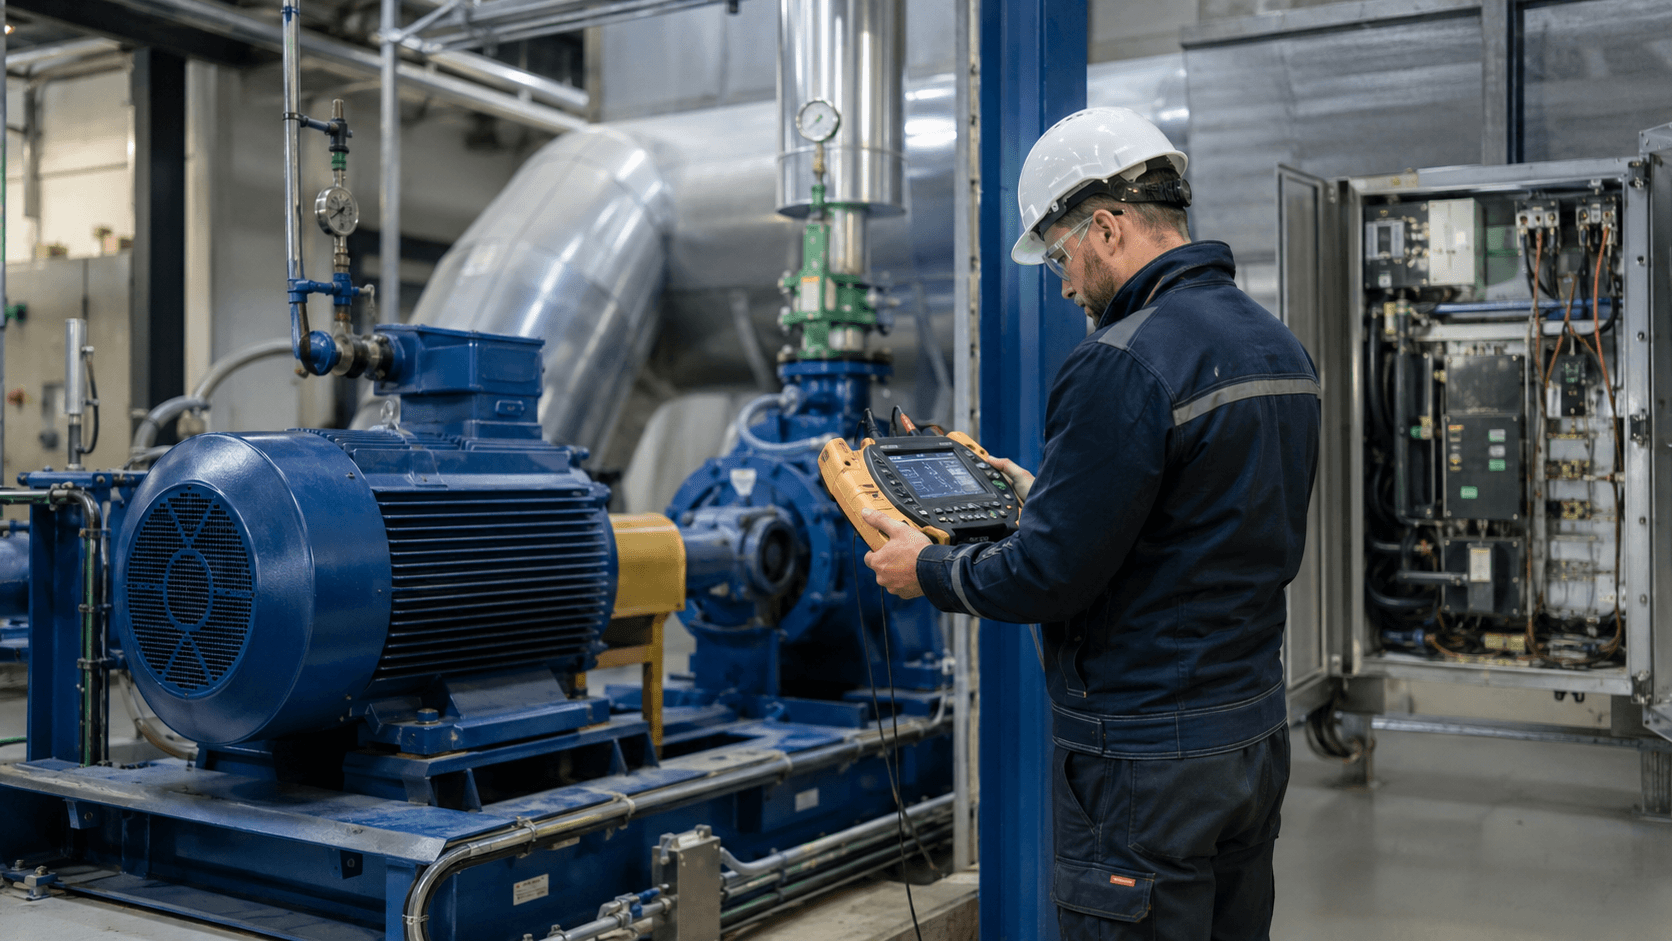
A high-efficiency motor can operate in a system that still consumes too much energy. The result depends not only on the motor itself, but also on the driven machine, the control method, the actual load profile, operating hours and whether the energy consumed translates into a useful process output. That is why an analysis of a drive system should begin not with the question “which motor should we buy?”, but with “what does the process actually need?”.
In practice, the greatest potential is often hidden in idling, oversizing of the entire system, flow throttling, excessively high pressure or capacity setpoints, unnecessarily constant speed, or poor coordination of multiple drives. Replacing the motor may be one option, but it should not automatically be the starting point.
In brief: where are savings most often found?
- Do not equate rated power with energy demand. A 90 kW motor does not continuously draw 90 kW. You need the actual active-power and operating-time profile.
- Check idling and downtime. A drive can consume energy without producing a useful process output.
- Assess oversizing of the whole system, not just the motor. An oversized pump, fan or gearbox, or an unsuitable operating point, is often the bigger problem.
- A variable speed drive has the greatest potential where demand genuinely changes. This applies particularly to pumps and fans currently controlled with a valve, damper or bypass.
- Do not apply the “cube law” to conveyors and many process drives. Their torque and energy demand depend on the nature of the process.
- Measure energy and process output at the same time. Motor current alone does not tell you whether the system is over-pumping, over-ventilating or running without product.
A drive system is more than the motor
The simplest analytical mistake is to limit the balance to motor efficiency alone. A typical chain includes the power supply, control system or variable frequency drive, motor, coupling or gearbox, driven machine and, ultimately, the process itself.
For a pump, the useful output is the required flow at the appropriate head. For a fan, it is the required airflow and pressure rise. For a conveyor, it is the mass of material transported. For a mixer, extruder or another process drive, it is the process parameters that must be maintained without compromising quality or throughput.
This approach is consistent with IEC 61800-9-2, which assesses the efficiency of drive systems with reference to system architecture, speed and torque profiles, and operating points over time. In other words, there is no single drive efficiency figure that can be meaningfully assessed without knowing how the equipment actually operates.
From an auditor’s perspective, I would first check how many kW the system draws in each operating state and what process output is obtained for that energy. Only then would I select the option: change the control strategy, install a variable speed drive, correct the operating point, change the gear ratio, select a smaller machine, or replace the motor.
Start with the actual load, not the nameplate
Rated power is not annual energy consumption
The power shown on a motor nameplate describes its ability to deliver mechanical power under specified conditions. It is not a constant electrical power demand. Two motors with the same rated power can have completely different annual energy consumption if one operates for 8,000 hours at high load and the other only a few hours a day with frequent stops.
Therefore, estimating consumption requires a profile of:
- active power in the individual operating states,
- the duration of those states,
- the corresponding load or process parameters.
U.S. Department of Energy technical materials on motor systems indicate that, with variable load, a single measurement captures only part of the picture. Power should be logged over time to obtain a reliable profile. Particular care is needed when estimating load from current alone: at low loads, the relationship between current and load is no longer sufficiently linear.
An oversized motor does not always mean an obvious replacement
If a motor operates at low load for most of the time, it is worth checking whether it can be more appropriately sized. This does not mean, however, that every motor operating below 50% load should automatically be replaced. Compare actual efficiency at the operating point, input power, operating hours, required starting torque, process reserve, and the cost and risk of the upgrade.
Even more important is distinguishing between an oversized motor and an oversized driven machine. For example, a pump selected for a flow far above what is needed and continuously throttled by a valve may offer greater savings potential than the efficiency difference between two motors of the same rating.
Idling can be an easier target than replacing equipment
A motor with no useful load still consumes energy. Examples include empty conveyors, fans left running after the process has finished, pumps maintaining an unnecessary circulation loop, or machines waiting between production batches.
The example is straightforward. If measurements show that a conveyor draws an average of 5.8 kW when running empty and this state lasts 3 hours per day for 250 days a year, eliminating that operation alone represents potential savings of:
5.8 kW × 3 h/day × 250 days = 4,350 kWh/year, or 4.35 MWh/year.
This is a calculation example, not the result of a specific project. In a real plant, you must also check whether frequent stopping of the drive is technologically permissible and whether it would increase the number of undesirable starts.
Variable speed drive: when can it actually reduce energy consumption?
A variable speed drive (VSD), or frequency converter, does not save energy merely by being installed in a cabinet. Its energy-saving value appears when changing speed reduces the power required to deliver the process output that is actually needed.
The best candidates are usually systems in which:
- the demand for flow, capacity or speed varies over time,
- the motor currently operates at constant speed,
- control is achieved by throttling, a damper, bypass or another source of losses,
- the machine has characteristics that are favourable for speed control,
- process parameters can be measured and used as a control signal.
Pumps and fans: high potential, but savings are not automatic
For rotodynamic pumps, under the appropriate assumptions, the affinity laws apply: flow varies in proportion to speed, head with the square of speed, and power demand with the cube of speed. The Hydraulic Institute gives the relationships Q ∝ n, H ∝ n² and P ∝ n³. For fans, the potential of speed control must likewise be assessed against the characteristics of the specific system and process requirements; the cubic example below should not be applied automatically to every fan application.
For such a rotodynamic pump, reducing speed to 80% gives, at an idealised reference point, approximately:
0.8³ = 0.512, or about 51% of the original mechanical power demand.
This result must not, however, be copied directly into an audit as “49% savings”. The installation has VSD and motor losses, their efficiency changes, and the system curve may include a substantial static component. If the pump must overcome nearly constant static pressure, the available speed-reduction range may be small. Likewise, a fan must maintain the minimum airflow required by the process, safety or ventilation requirements.
In its guidance for pump systems and fan systems, the U.S. DOE treats speed control as one system-level option alongside correct equipment sizing, operating-point optimisation, reducing unnecessary operation and improving control.
When might a variable speed drive fail to deliver the expected result?
Savings may be small or zero when:
- the drive must operate close to rated speed for most of the time anyway,
- the process requires constant torque and the same mechanical work to be performed, only over a different period of time,
- reducing speed makes the equipment operate proportionally longer,
- the pump operates in a system with high static head and has only a small permissible control range,
- the system is already controlled efficiently and there is no throttling or excess capacity,
- the limitation lies in the process machine itself rather than motor speed,
- losses and technical requirements associated with the variable speed drive are omitted from the calculations.
A variable speed drive may also be justified for other reasons: soft starting, improved control, reduced transients or adjustment of process capacity. This is not the same as saving energy. An upgrade should additionally verify the motor’s suitability for converter-fed operation, cooling conditions and any required derating, motor–converter interface parameters, installation method and manufacturer requirements. IEC TS 60034-25:2022 describes the performance characteristics of converter-fed AC machines as well as interface parameters and installation guidance for the drive system.
Four examples: pump, fan, conveyor and process drive
1. Pump controlled by a valve
Assume a pump operates at constant speed virtually all year, while the control valve is partly closed for a significant share of the time. The first conclusion should not be “install a variable speed drive”, but rather a set of questions:
- what is the actual flow rate,
- what is the pressure difference or head,
- where is the pump operating point,
- how many kW does the motor draw,
- how often is the valve partly closed,
- does the system have a significant static-pressure component,
- is one pump operating, or several in parallel.
Only with these data can you compare options such as speed control, impeller modification, pump replacement, better control of parallel pumps or setpoint adjustment. A whole-system approach also underpins ISO/ASME 14414:2019, which addresses the energy assessment of the entire pumping system, from energy input to the work performed.
2. Fan with a damper
If a fan runs at constant speed while airflow is restricted by a damper, speed control often becomes a natural option to assess. Measuring motor power alone is not enough, however. You also need the airflow or proxy parameters, pressure rise, damper position, required negative or positive pressure, and minimum process requirements.
It is also worth checking whether the pressure setpoint is kept unnecessarily high. Sometimes the saving comes not from the VSD itself, but from the correct control signal and a lower setpoint during periods of reduced demand.
3. Conveyor
A conveyor is a good example of why one rule cannot be applied to every drive. In many conveyors, the load is approximately constant-torque. Reducing speed by 20% therefore does not automatically mean that power will fall to about half, as in the idealised fan example.
If the same mass of material still has to be transported, a lower speed may simply extend operating time. Savings potential is worth looking for elsewhere:
- empty running,
- unnecessary operation between batches,
- poor sequencing of several conveyors,
- speed that is too high relative to the required line throughput,
- gearboxes and belts in poor condition or incorrectly selected,
- misalignment, mechanical resistance and maintenance issues.
A variable speed drive can improve control and match speed to line throughput, but its energy effect must be calculated from the actual torque, speed and operating-time profile.
4. Process drive
In a mixer, mill, extruder, centrifuge or another process machine, the key is to determine the relationship between speed, torque and product quality. You often cannot simply reduce speed because this may change cycle time, temperature, homogenisation, particle size or production throughput.
On the other hand, analysis may reveal that the system consistently operates at a higher speed or torque than the recipe requires. Savings may then come from recipe-based control, sequence changes, shorter run times, better use of the drive or a different gear ratio. In such applications, measuring energy without simultaneously recording production parameters is particularly risky.
When does replacing a motor with a more efficient one make sense?
Replacing a motor is a rational option, among other cases, when the equipment operates many hours per year, has a significant share of energy consumption, an overhaul-versus-replacement decision is approaching, its actual efficiency or technical condition is known, and the entire system is correctly sized. The difference in losses between the old and new motor can then be calculated for the actual operating point.
However, “old” should not automatically be equated with “worth replacing immediately”. The economic result depends, among other things, on annual operating hours, load, energy cost, upgrade cost, process requirements and the ability to use a planned production shutdown.
Details of efficiency classes and the motor itself are a separate, narrower topic. This guide deliberately focuses on the whole drive system: the control method, actual load, driven machine and process output.
IE class versus savings in an existing installation
Product requirements and the analysis of savings in an existing system are two different issues. The applicable Commission Regulation (EU) 2019/1781 sets ecodesign requirements for electric motors and variable speed drives within its scope. IEC 60034-30-1:2025, in turn, classifies the efficiency of specified line-operated motors, but does not cover the efficiency of the complete Power Drive System.
Meeting product requirements therefore does not prove that an existing process operates in the most energy-efficient way. You can have an efficient IE3 or IE4 motor and still waste energy through throttling, idling, an unsuitable process setpoint or an oversized machine.
What measurements are needed for a reliable drive analysis?
The best measurement scope depends on the type of machine, but in practice electrical data should be combined with process data.
| Area | What to measure or collect | Why? |
|---|---|---|
| Motor data | power, voltage, current, speed, efficiency class, rated efficiency, duty | equipment identification and reference point |
| Electrical energy | kW, kWh, voltages, currents, power factor, frequency; and, where needed, power-quality parameters | actual demand and load profile |
| Operating time | operating hours, stops, idling, number of cycles and starts | annual energy and the share of individual operating states |
| Speed and control | VSD frequency in Hz, rpm, setpoint signal, valve or damper position | verification of the control method |
| Pump | flow, pressures, head, valve status, pump configuration | determination of the operating point and comparison of options |
| Fan | airflow, pressure rise/pressure, damper positions, required minimum flow | assessment of control and actual demand |
| Conveyor | mass or throughput in t/h, loaded/empty state, speed, run time | energy consumption relative to material transported |
| Process | production, recipe, torque/cycle, temperature, pressure or another quality parameter | confirmation that the saving is not caused by lower production |
| Mechanical system | condition of gearboxes, belts, couplings and bearings, alignment; vibration and temperature where required | identification of additional losses and maintenance issues |
In a constant-load system, a series of properly taken spot measurements may sometimes be sufficient. With variable load, a power logger is needed to capture representative changes, production shifts, recipes and stops. For season-dependent equipment, the observation period must be appropriately longer.
Time synchronisation is critical. A kW chart without information about what the machine was doing at that moment often explains very little. If power fell by 20%, you need to know whether control improved or production simply fell by 20% at the same time.
How to calculate savings without the common mistakes
The basic rule is simple: energy must be calculated from actual power and operating time in each state.
E = Σ(Pi × ti)
For a production line, it is also useful to use a specific indicator such as kWh/t, kWh/unit or kWh/cycle. This makes it possible to distinguish an efficiency improvement from a simple change in production volume.
For an option involving a VSD, account not only for the change in machine demand, but also for motor and converter efficiency at the new operating points. The effect must not be counted twice, for example by adding “VSD savings” and “motor savings” if both have already been determined from the difference in total system power demand.
For rotodynamic pumps, the affinity laws are a useful tool for an initial understanding of the potential of speed changes. A final audit, however, should be based on data on the system curve, operating point and actual demand profile. For fans and other machines, the relationship must be verified against their own characteristics and process conditions.
How should upgrade priorities be set?
| Signal from the installation | What to check first | Possible direction |
|---|---|---|
| many operating hours and high energy consumption (kWh) | actual load and efficiency at the operating point | replacement or correct motor sizing, but only after system analysis |
| pump or fan continuously throttled | flow, pressure, system curve, valve/damper position | speed control, operating-point adjustment, equipment sizing |
| frequent operation without product | kW at idle and duration of this state | automatic shutdown, sequence change, control |
| large fluctuations in demand | power profile (kW) and process parameters | variable speed drive or other demand-based control |
| conveyors running empty | empty-running periods and dependencies between sections | start/stop sequence, sensors, PLC logic |
| variable speed drive continuously operating at 50 Hz | frequency profile and actual need for control | setpoint optimisation; the VSD itself does not create savings |
| low production with high energy consumption | kWh per unit of product, mechanical condition, process parameters | diagnosis of the process, gearbox, driven machine and control |
This sequence helps avoid investing first in the most visible component. In a well-executed analysis, the list of upgrades should result from the energy and process balance, not from a catalogue of available equipment.
The most common mistakes in motor and drive audits
- Annual consumption calculated as rated power × 8,760 hours. This ignores actual load and operating time.
- Comparing IE classes only. This does not reveal losses in control, the gearbox, pump, fan or process.
- Recommending a variable speed drive for every drive. Variable speed only makes sense when it matches the load characteristics and the process.
- Applying the cube law to a conveyor or another constant-torque load. This overestimates savings.
- Assessing load from instantaneous current alone. Without active power, power factor and a time profile, the operating point can be assessed incorrectly.
- Ignoring idling. Sometimes control changes deliver cheaper and faster savings than equipment replacement.
- Comparing two periods with different production levels without normalisation. Lower kWh does not necessarily mean improved efficiency.
- Double-counting savings. Effects from the motor, VSD and process change must form one consistent balance.
What should a practical drive-system audit look like?
- Define the useful process output. Flow, pressure rise, t/h, torque, speed, cycle or another process parameter.
- Identify the drives with the highest annual energy consumption, not just the highest rated power.
- Collect documentation and automation-system data. Also determine which information needs to be measured independently.
- Log power and process parameters over a representative period. Separate full load, part load, stops and idling.
- Assess the characteristics of the driven machine. A centrifugal pump is analysed differently from a conveyor or mixer.
- Develop several upgrade options. Control changes, setpoint correction, reduction of idling, correct equipment sizing, variable speed drive, gear-ratio change, motor replacement.
- Compare the options at the same required process output. Include energy, cost, risk, maintenance and impact on production.
- After implementation, perform verification measurements. Preferably use the same points and operating states that formed the baseline.
If a plant has many drives, continuous monitoring of energy and process parameters is useful because it can reveal changes in the operating profile, rising idle consumption or unfavourable changes in settings. For a specific upgrade, the baseline and post-change case should be compared for the same process function and using the same defined measurement method.
What does this mean in practice?
With electric drives, savings rarely come down to “replace the motor with a higher-efficiency class” or “add a VSD”. First determine where energy is being consumed without a useful output: during idling, throttling, excessive speed, unnecessary reserve capacity, poor sequencing or operation at the wrong machine operating point.
Only power measurements combined with load and process parameters can show whether the most cost-effective option is a control change, operating-point correction, correct equipment sizing, a mechanical upgrade or replacement of the motor itself. This system-level approach helps avoid an investment that looks good in a catalogue but fails to deliver the expected result on the energy meter.
Sources
- IEC 61800-9-2:2023+AMD1:2025 – Energy efficiency determination and classification
- IEC 60034-30-1:2025 – Efficiency classes of line operated AC motors
- IEC TS 60034-25:2022 – AC electrical machines used in power drive systems
- Commission Regulation (EU) 2019/1781 – EUR-Lex, consolidated version
- ISO/ASME 14414:2019 – Pump system energy assessment
- U.S. Department of Energy – Motor Systems
- U.S. Department of Energy – Pump Systems
- U.S. Department of Energy – Fan Systems
- Hydraulic Institute – Pump Curves and Affinity Rules