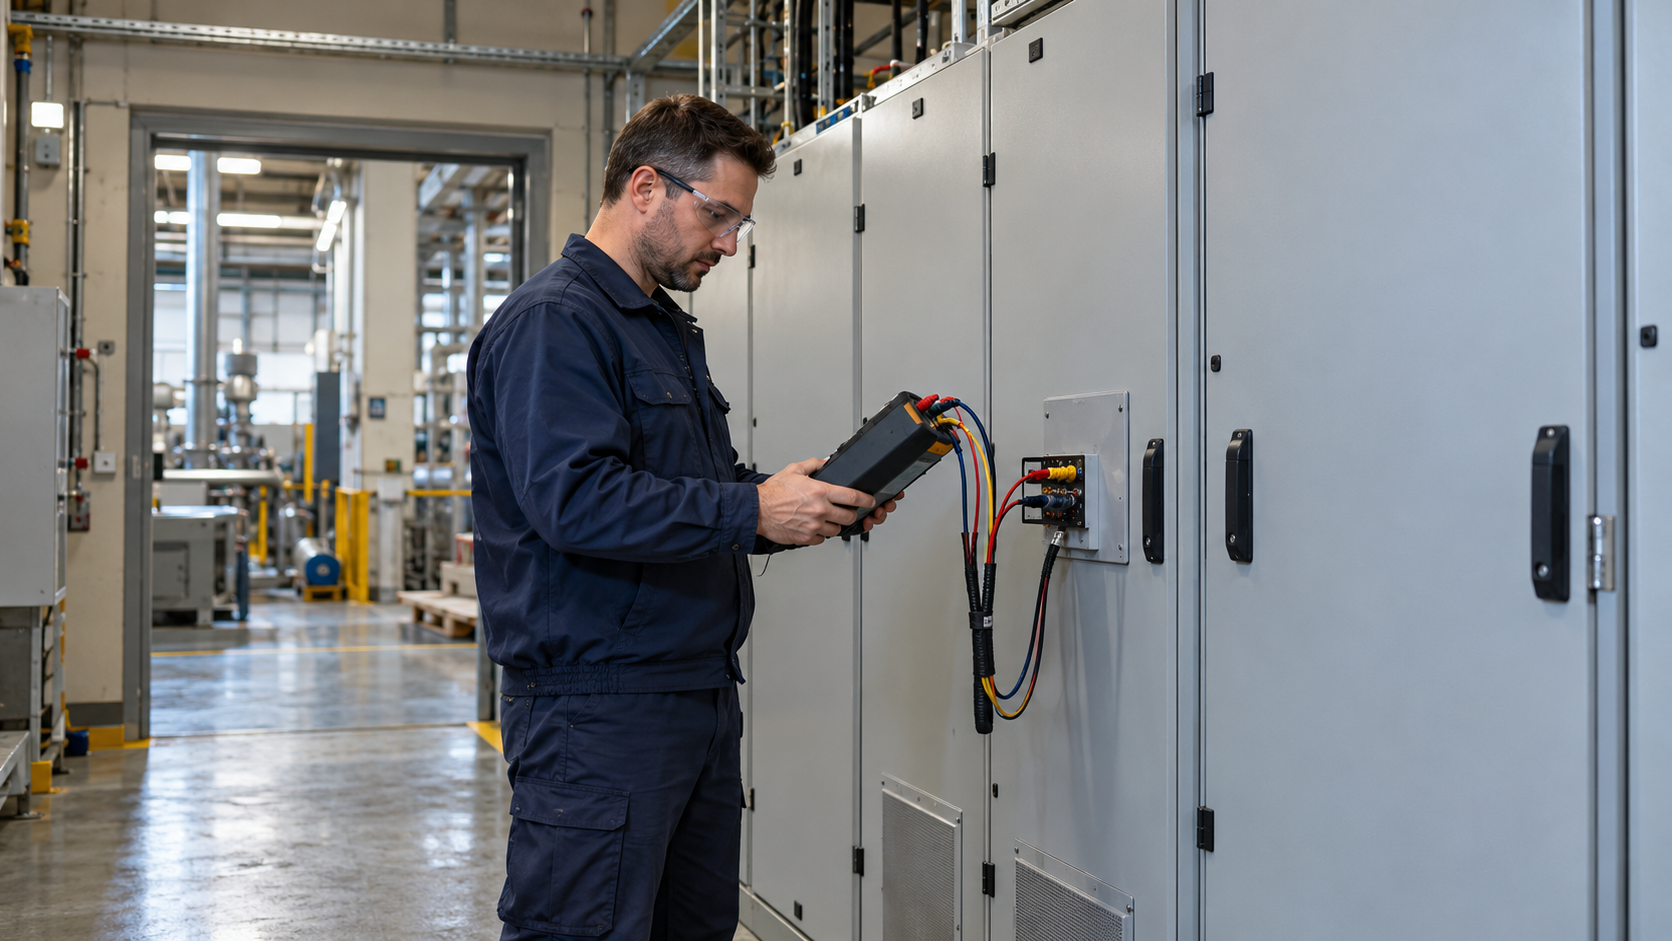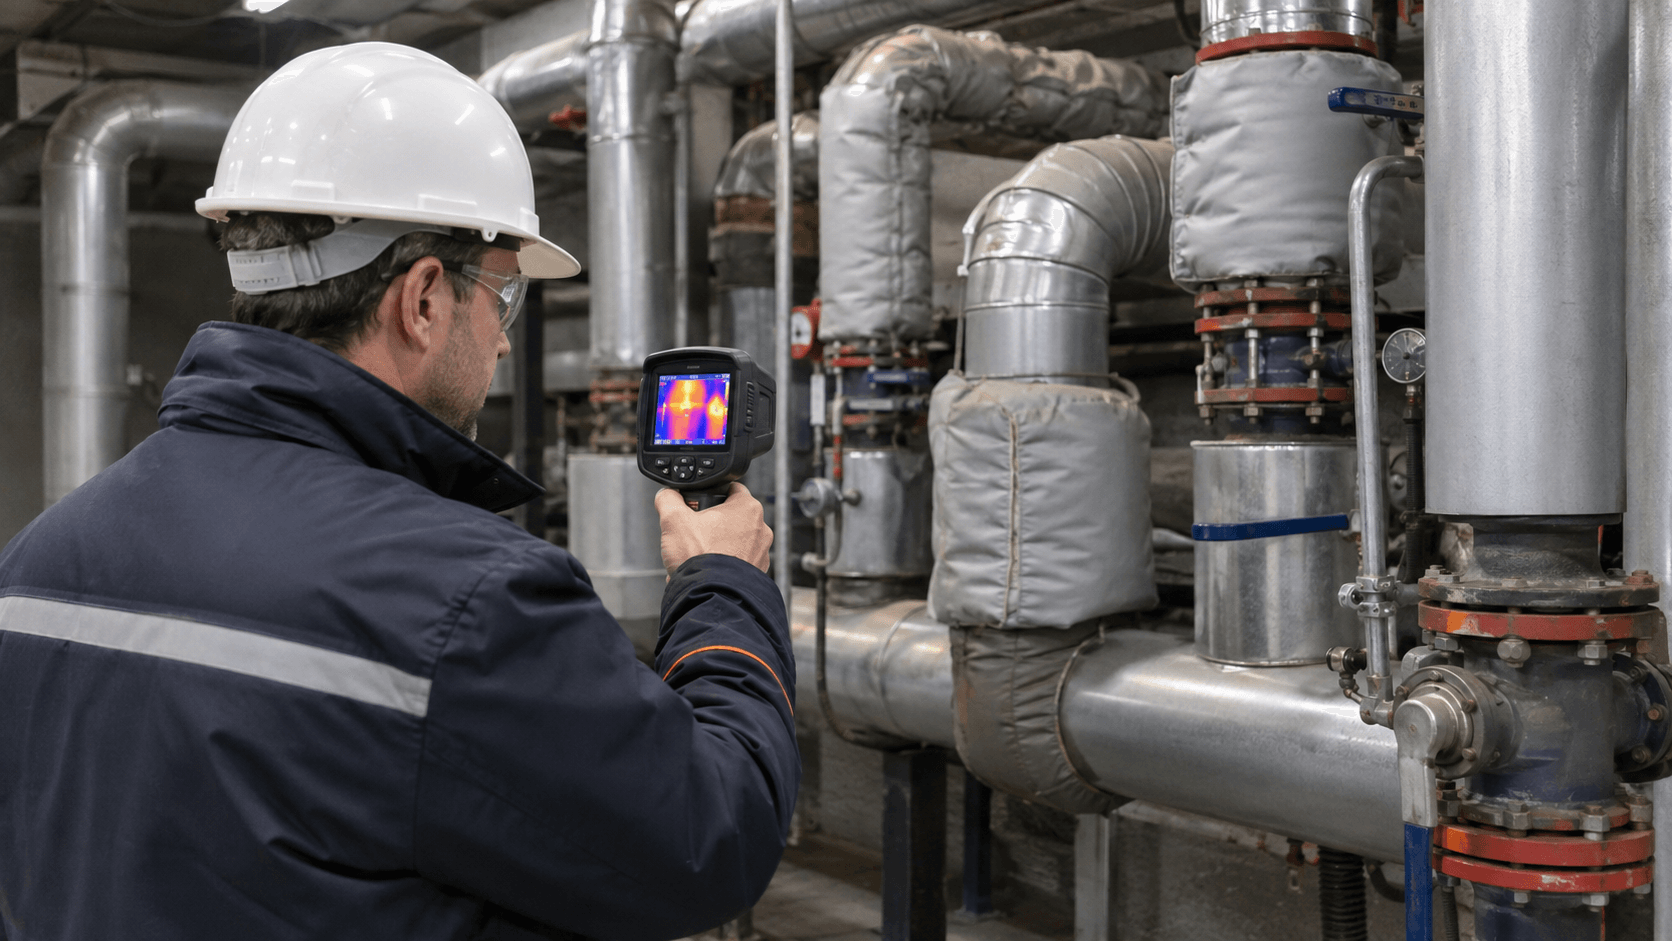
Thermographic inspections of heating installations are particularly useful wherever areas with an unusual temperature distribution need to be identified quickly, without shutting down the entire installation and without contact with a hot surface. A thermal imaging camera can indicate damaged insulation, uninsulated valves and fittings, local thermal bridges, overheating components, differences between similar system branches, or areas where leaks should be investigated. Correct interpretation is essential, however: a thermogram shows a thermal effect at the surface, not a ready-made diagnosis of the cause of the problem.
From an auditor’s perspective, the key question is therefore not “is there a red area in the image?”, but “why does this component have a different temperature than it should under these operating conditions, and what technical decision follows from that difference?”
What does a thermal imaging camera actually show?
A thermal imaging camera records infrared radiation reaching the detector. After the measurement parameters have been taken into account, it can use this information to determine the surface temperature of the object being examined. The result depends not only on the actual surface temperature, but also, among other factors, on emissivity, radiation reflected from the surroundings, distance and atmospheric conditions.
A colour image is therefore not a direct map of energy losses. The colour palette and an automatically selected temperature range can make even a small temperature difference look very pronounced. In technical analysis, the temperature values, differences from a reference point, anomaly geometry, operating conditions of the installation and repeatability of the observation are more important than the colour itself.
The standards ISO 18434-1 and ISO 18434-2 describe thermography as a tool used for condition monitoring and diagnostics of machinery and auxiliary equipment, including valves, fluid machines and heat exchangers. They also address how measurements should be performed, criteria for assessing anomalies, image interpretation, reporting and compensation for parameters such as emissivity and reflected temperature.
What can be detected during thermographic inspections of heating installations?
Damage, missing sections and discontinuities in thermal insulation
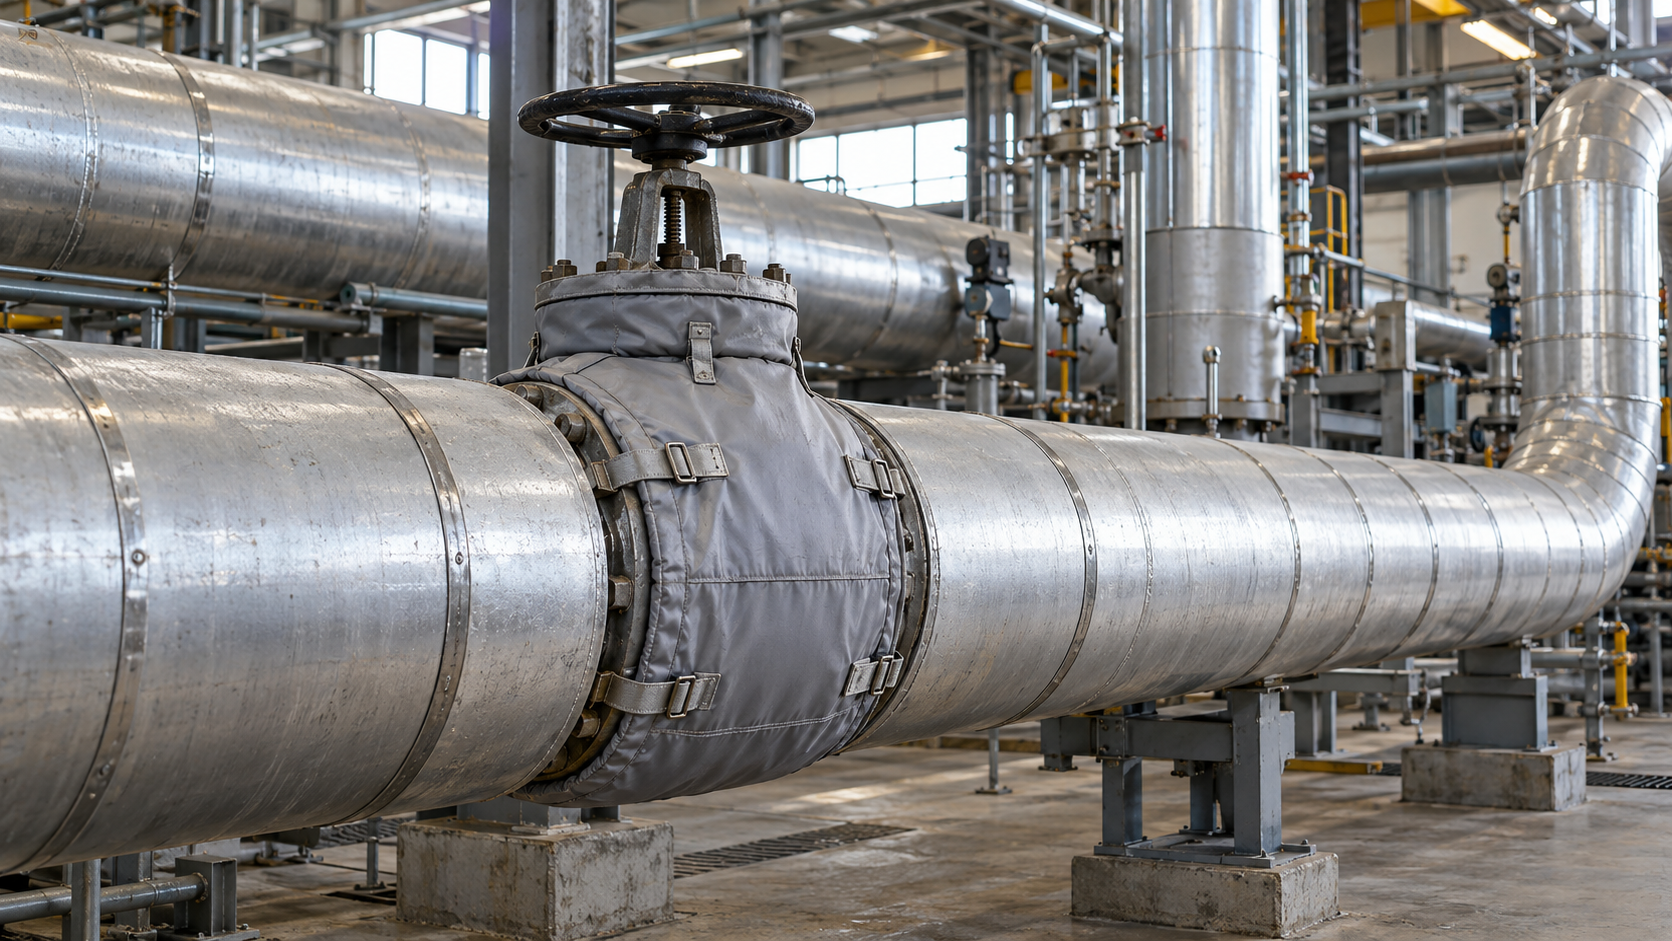
This is one of the most natural applications of thermography in installations carrying hot water, steam or another heating medium. If the insulation is locally damaged, compressed, interrupted or simply missing, the temperature of the outer surface can differ clearly from adjacent sections of similar construction and load.
Particular attention should be paid to:
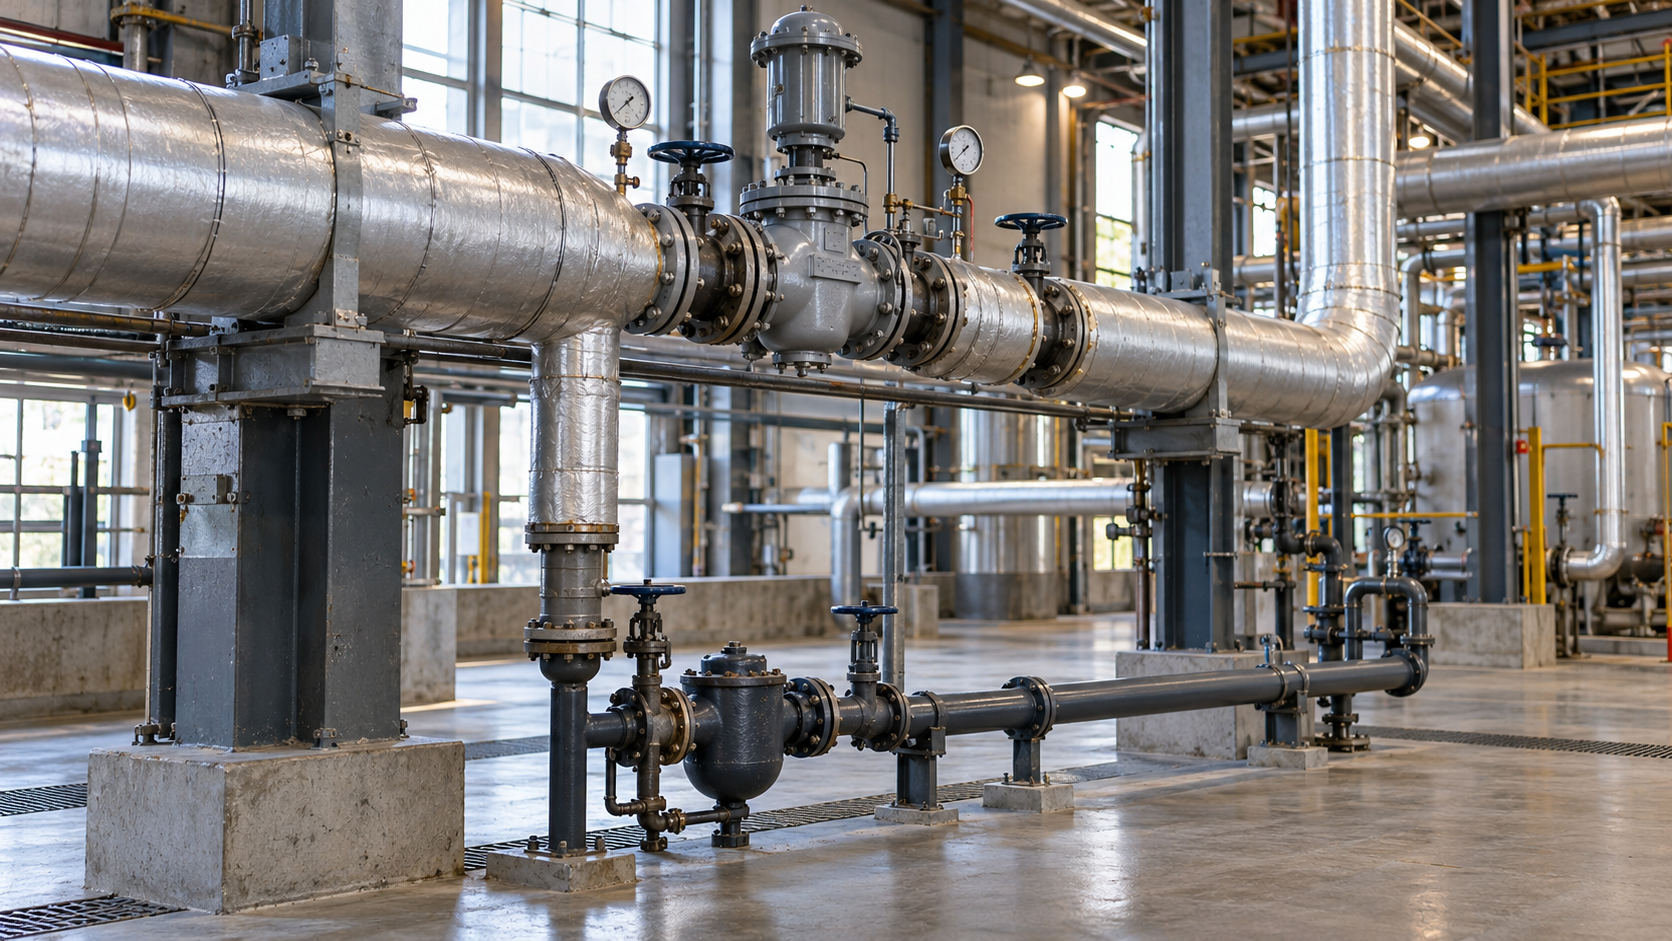
- valves, flanges, filters and steam traps,
- pump casings and valve or fitting components,
- joints between insulation sections,
- pipe supports and hangers,
- penetrations through partitions,
- locations of previous repairs,
- sections exposed to moisture or mechanical damage.
In practice, the problem does not have to be a complete absence of insulation. An anomaly may also be caused by a local reduction in insulation thickness, deterioration of the material properties, a leaking protective cladding or a conductive thermal bridge through a metal structural component.
Potential areas of increased heat loss
If a pipe carries a hot medium, a locally elevated surface temperature may indicate increased heat transfer to the surroundings. Thermography is very well suited to screening: it makes it possible to quickly identify which components should be subjected to more detailed analysis first.
This does not mean, however, that heat losses in kW or MWh can be read directly from a thermogram. Estimating them requires, at a minimum, information about the geometry of the component, the temperature of the medium and the surroundings, the design and condition of the insulation, operating time and heat-transfer conditions. A thermogram helps locate the area and determine surface temperature; an energy balance requires an additional calculation step.
Overheating components and unusual hot spots
An elevated temperature of a pump casing, bearing assembly, valve, actuator, heat exchanger or another component may indicate an unusual operating condition. A high value alone does not prove a fault — some equipment normally operates at high temperatures. A much more reliable basis is comparison:
- with the same type of equipment operating under similar conditions,
- with an earlier measurement of the same component,
- with the temperature specified by documentation or resulting from process conditions,
- with other points on the same assembly.
In this way, thermography can help identify a component for further inspection before a decision is made to dismantle or repair it.
Uneven operation of the installation
A thermogram can reveal differences between parallel branches, heat exchangers, heat consumers or pipe sections that should theoretically operate in a similar way. An unusual temperature distribution may, for example, be associated with a different flow rate, valve position, air lock, fouling, incorrect control or a change in the load of the heat consumer.
This is a good example of a situation in which a thermal image indicates where to look, but does not yet answer what the cause is. Resolving the issue may require measurements of flow, pressure and medium temperature upstream and downstream of the component, a reading from the control system or verification of the valve settings.
Thermographic inspection of flue-gas ducts
In industrial installations, thermography can also be used to assess the external surfaces of flue-gas ducts and hot process piping. A local hot spot on the cladding may suggest a problem with insulation, refractory lining, segment joints or another local discontinuity in the thermal protection.
Damage should not, however, be diagnosed solely from the colour of a thermogram. The duct design, process temperature and load and previous measurements must be taken into account and — if the anomaly is significant — the condition should be confirmed during a technical inspection.
Underground pipelines and district heating networks
Thermography of the ground surface or aerial measurements can support the location of thermal anomalies above underground network routes. This is a screening method whose effectiveness depends on many factors: pipeline depth and design, type of surface and soil, ambient temperature, weather, solar radiation and other nearby heat sources.
Recent research on the analysis of aerial thermal imagery of district heating networks shows that conventional hot-spot detection can produce both false positives and missed detections. Reliability improves only when the temperature along the network axis is compared with the surroundings and the context is verified. A hot area above a pipeline route should therefore be treated as a location for further diagnostics, not as automatic confirmation of a leak.
A thermogram is not a diagnosis. How do you move from observation to decision?
The greatest value comes from combining the thermal image with information about the installation. The examples below show the appropriate decision-making process.
| Thermographic observation | What it may indicate | What else should be checked | Typical decision |
|---|---|---|---|
| An uninsulated valve is significantly hotter than the adjacent insulated pipe | increased heat release from the valve or fitting | medium temperature, operating time, valve dimensions, feasibility of installing removable insulation | estimate of heat losses and cost-effectiveness of installing insulation |
| Local hot band beneath the insulation cladding | gap, compression, wet insulation or a thermal bridge | inspection of the cladding, insulation documentation, test opening at a safe location | local repair or further inspection of the insulation |
| One of two similar branches is clearly cooler downstream of a valve | lower flow, different valve position, air lock or different heat demand | valve position, flow, pressure, medium temperatures, control settings | adjustment or hydraulic measurements before repair |
| Hot spot on the outer surface of a flue-gas duct | local insulation or lining problem, but possibly also a design feature | duct documentation, burner/process load, comparative measurement, inspection during shutdown | technical inspection and possible local repair |
| Thermal anomaly on the surface above the network route | possible leak or deterioration of insulation, but also the influence of other heat sources | network map, weather conditions, repeat measurement, operating parameters and heat-transfer fluid losses | narrowing down the area for further diagnostics |
From an auditor’s perspective: the safest approach is to treat thermography as a tool for forming a hypothesis. A sound diagnosis is reached only when the anomaly on the thermogram is consistent with the operating conditions of the installation, process data and — where necessary — an additional measurement.
Surface emissivity — the most common source of incorrect temperature readings
Emissivity describes the ability of a surface to emit thermal radiation. It is a key parameter when measuring temperature with a thermal imaging camera. Problems arise particularly with clean, shiny metals, which have low emissivity and strongly reflect radiation from the surroundings.
In practice, polished metal can appear hotter or colder on a thermogram not because it actually has that temperature, but because it reflects a hot component of the installation, the sky, the operator or another radiation source. FLIR notes that polished copper and aluminium surfaces can have an emissivity below 0.10, whereas oxidised or rough surfaces usually have a much higher emissivity.
A single emissivity value should therefore not be entered automatically for all components. If a more accurate temperature measurement is required on a low-emissivity surface, a marker or material with a known high emissivity can be applied — provided that conditions and safety allow it — and the measurement can be taken after its temperature has stabilised.
How do measurement conditions affect the result?
Ambient temperature and the operating state of the installation
A comparison is meaningful only when the conditions under which the installation is operating are known. Start-up, shutdown, a change in load or a temporary change in medium temperature can create temperature distributions that do not occur during normal steady-state operation. The report should record at least the ambient temperature and the basic process parameters at the time of the inspection.
Wind, rain and solar radiation
Wind increases surface cooling, precipitation changes surface temperature and radiative properties, and the sun can heat a component independently of the medium inside it. This is particularly important for outdoor measurements and when assessing underground pipelines from surface temperature. If successive inspections are to be compared, the conditions should be as similar as possible.
Distance, resolution and focus
The fact that a small component is visible on the screen does not mean that its temperature can be measured accurately. As distance increases, a single pixel covers an increasingly large part of the object. For an accurate measurement of a small target, the spatial-resolution parameter and the distance-to-target-size relationship must be checked; FLIR gives a practical rule of at least a 3 × 3 pixel area for the target being measured.
Digital image zoom does not recover missing measurement data. If the detail is too small, the solution is to safely reduce the distance, use suitable optics or use a higher-resolution camera.
Reflected temperature, humidity and atmosphere
For more accurate radiometric measurements, reflected apparent temperature, atmospheric temperature, relative humidity and distance also matter. FLIR measurement documentation identifies these parameters as part of the measurement configuration, with the influence of some of them increasing at longer distances. If the measurement is made through an infrared window or another medium, its transmissivity must also be taken into account.
Viewing angle and surface geometry
A shiny cylindrical pipe can reflect its surroundings differently depending on the viewing angle. Changing the camera position and observing whether a suspicious point “moves” with the reflection is a simple way of identifying some artefacts. Measurements should be made as repeatably as possible, and both the thermogram and a visible-light image should be documented.
How to correctly perform a thermographic audit of an installation — step by step
Simply collecting a large number of images rarely provides a good answer. It is much better to start with the decision that the measurement is intended to support.
- Define the diagnostic question. Are we looking for heat losses through insulation, a suspected leak, uneven operation of a branch or an overheating component?
- Collect baseline data. System diagram, medium, typical temperatures and pressures, diameters, insulation information, operating time and load.
- Select a representative operating condition. For comparisons, the installation should preferably operate at a stable and typical load.
- Record inspection conditions and camera parameters. Ambient temperature, weather conditions, distance, emissivity, reflected temperature and other parameters relevant to the measurement.
- Capture reference images. It is useful to have both a thermogram and a visible-light image and, for important components, a wider view as well as a close-up.
- Compare like with like. The difference between two similar valves operating under the same load says much more than the fact that one of them has a particular temperature.
- Separate the anomaly from the hypothesis. The report should distinguish between what was measured, what may be the cause and what needs to be checked to confirm it.
- Assign an action. Minor insulation repair, valve inspection, flow measurement, equipment diagnostics or observation during the next inspection.
- Verify after repair. A repeat image taken under similar conditions makes it possible to check whether the anomaly has actually disappeared.
What additional data are needed to interpret a thermogram?
Depending on the issue, the following may be useful:
- supply and return medium temperature,
- pressure and flow,
- valve positions and control settings,
- pipe diameter, material and geometry,
- insulation type, thickness and condition,
- operating time of the installation and load profile,
- equipment documentation and allowable temperatures,
- contact measurement at a reference point,
- history of previous thermograms,
- data on medium losses or the network balance,
- results of other diagnostic methods, e.g. ultrasonic, flow or pressure measurements, or mechanical inspection.
If the objective is to calculate the economic effect of an insulation repair, the thermal image should only be the starting point for the calculations. In a simplified approach:
annual avoided energy [kWh/year] = (heat loss before repair [kW] − heat loss after repair [kW]) × operating time [h/year]
annual cost savings [zł/year] = avoided energy [kWh/year] × assumed energy cost [zł/kWh]
simple payback period [years] = investment expenditure [zł] / annual cost savings [zł/year]
If the energy price is stated in zł/MWh or zł/GJ, the units must be made consistent before the calculation. It is also essential that the heat-loss values result from an engineering calculation or appropriate measurements and installation data. They should not be derived solely from the colour of a surface on a thermogram.
When is thermography not enough?
Thermography is a very effective screening tool, but it has limitations. A thermal imaging camera alone should not be the sole basis for:
- determining the exact leak flow rate,
- determining the energy losses of an entire component without geometric and operating data,
- confirming the cause of damage hidden beneath insulation,
- assessing the internal condition of a pipeline,
- determining whether the insulation construction complies with a specific standard or design,
- making an expensive repair decision when an anomaly may have several different causes.
In such cases, the result should lead to a further, more targeted measurement. This is what reduces the risk of repairing a component that looks unusual on a thermogram but is in fact operating correctly.
Thermographic inspection and thermographic audit — are they the same?
The terms are often used interchangeably, but in practice it is useful to distinguish between them. A thermographic inspection may mean a single measurement session or investigation of a specific problem. A thermographic audit should follow a broader logic: objective, scope, reference conditions, assessment criteria, documentation of anomalies, their priorities, verification using additional data and recommendations.
For an industrial installation, a properly performed thermographic audit therefore does not end with a set of colourful images. The result should explain which observations are significant, what the problem may stem from, how confident that interpretation is and what should be done next.
How should an inspection be planned so that the result is useful?
Before commissioning measurements, it is worth preparing a short list of information:
- which installations and equipment are most important in terms of cost or process,
- which locations have previously been repaired or caused problems,
- when the installation operates at a typical load,
- which temperatures and flows are regarded as normal,
- whether diagrams, control-system data and insulation documentation are available,
- which anomalies require an immediate decision and which can be monitored over time.
This makes it possible to perform the inspection not as an incidental walk-through with a camera, but as planned diagnostics focused on specific technical decisions.
Summary
Thermographic inspections of heating installations make it possible to quickly locate areas where the temperature distribution differs from what is expected. They can reveal insulation problems, thermal bridges, unusually hot components, uneven system operation or areas that should be checked for leaks. Their greatest value, however, only appears when the thermogram is combined with process knowledge and additional measurement data.
If the analysis is intended to support an investment or repair decision, thermography should be combined with the broader scope of energy audits and measurements and — for process heat losses — with an assessment of heat recovery opportunities. The objective is not to take as many images as possible, but to identify actions whose technical and economic effects can actually be verified.
Sources
- ISO 18434-1:2008 — Condition monitoring and diagnostics of machines — Thermography — Part 1: General procedures
- ISO 18434-2:2019 — Condition monitoring and diagnostics of machine systems — Thermography — Part 2: Image interpretation and diagnostics
- Teledyne FLIR — Measuring temperatures
- Teledyne FLIR — How Does Emissivity Affect Thermal Imaging?
- Teledyne FLIR — How Far Can You Measure with a Thermal Camera?
- Risch T., Weidauer A., Hadavand A. — Guided Leak Detection in District Heating Networks from Aerial Thermal Imagery, ISPRS Annals, 2026