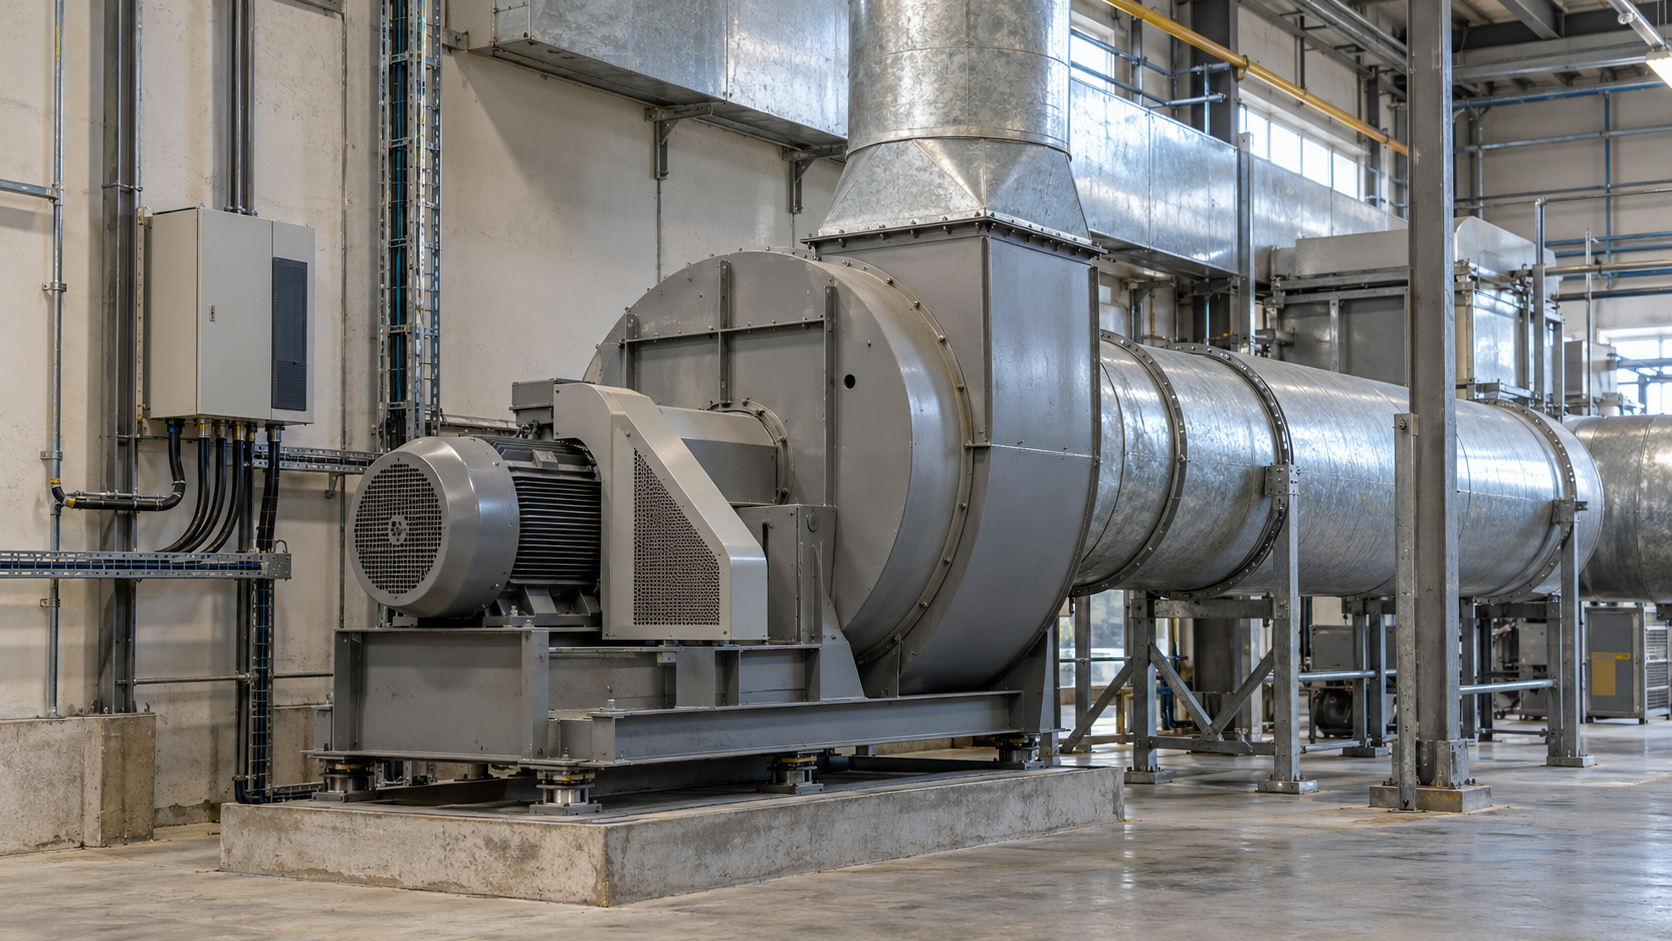
A variable frequency drive (VFD) allows a fan motor’s speed to follow actual air demand. It is usually most worthwhile where the system operates below design airflow for many hours and currently uses a damper to control flow or continuously supplies excess air. Installing a VFD alone, however, does not guarantee savings.
Before making a decision, determine the required airflow, system resistance, existing power demand and conditions for safe fan operation. Only then can you select a control method and compare energy use before and after the upgrade.
When does a variable frequency drive make sense for a fan?
The strongest candidate is a fan whose duty changes with production, building occupancy, thermal load or the number of operating workstations. If the fan runs at a constant speed while a partly closed damper restricts airflow, some of the energy is spent overcoming the additional resistance.
A VFD can lower motor speed, supplying less air with less throttling. Examples include certain process ventilation systems, extraction systems with variable loads and air handling units. In a broader assessment of a company’s energy efficiency, this is one possible drive upgrade, not a universal way to cut costs.
If the process requires constant airflow for almost the entire year, a VFD may provide soft starting or more precise control, but its own losses can reduce or eliminate the energy benefit. Where a fan is permanently oversized, also compare changing the belt-drive ratio or selecting a different fan. Existing fans with electronically commutated (EC) motors may already have integrated speed control, so adding a conventional VFD should not be assumed to be appropriate.
What data should you collect before selecting VFD control?
Start with the required airflow profile, not the rated motor power on the nameplate. Distinguish maximum, typical and minimum operating conditions and establish how long each occurs. A frequency reading in hertz is not a substitute for measuring airflow.
| Area | What to check | Why it matters |
|---|---|---|
| Process demand | Required airflow in m³/h, minimum permissible flow and operating schedule | Identifies the operating conditions in which output can safely be reduced |
| Fan and system | Flow–pressure curve, power curve, speed, impeller type, dampers, filters and duct resistance | Helps establish the operating point and stable control range |
| Drive | Motor nameplate and documentation, current, voltage, cooling method, belt ratio and cable length | Determines whether the drive is suitable for speed control |
| Energy consumption | Electrical input power in kW under different conditions and hours per year for each condition | Provides the baseline for comparing energy use in kWh/year |
| Control requirements | Sensors, controller, alarm signals, interlocks, fault conditions and any fire-safety functions | Prevents the system from losing a required function |
If complete manufacturer curves are unavailable, start by taking measurements at several repeatable operating points. In process ventilation, also account for dust loading, temperature and the density of the conveyed gas. A dirty filter or changes to ductwork can shift the operating point even at a constant speed.
Dampers and VFDs change the operating point in different ways
A fan develops a certain pressure rise at a given airflow. Its actual operating point is the intersection of the fan curve and the system curve. Closing a damper increases flow resistance and moves the operating point along the fan curve without changing fan speed.
Speed control changes the fan curve itself. At lower demand, it can reduce both the energy transferred to the air and the losses caused by throttling. However, the comparison must use the same required airflow and process conditions. Comparing an old system at full capacity with a new system delivering less air than the process needs, and calling the entire difference a saving, is not valid.
System geometry also matters. Additional elbows immediately upstream of the inlet, swirl, leaks or fouling can reduce efficiency regardless of the drive. These effects are explained in the U.S. Department of Energy’s guide to fan systems.
How much energy can a VFD save? The limits of the cube law
In a simplified case involving the same fan, constant gas density and comparable aerodynamic conditions, the affinity laws describe how performance varies with speed:
- airflow changes approximately in proportion to speed: Q₂/Q₁ ≈ n₂/n₁;
- pressure rise varies with the square of the speed ratio: Δp₂/Δp₁ ≈ (n₂/n₁)²;
- fan shaft power varies with the cube of the speed ratio: P₂/P₁ ≈ (n₂/n₁)³.
At 80% of the original speed, the theoretical shaft power is 0.8³ = 0.512, or 51.2% of its initial value. This represents a theoretical 48.8% reduction in shaft power where the affinity laws apply. It does not automatically mean 48.8% less electricity drawn from the grid or the same annual energy saving.
The actual result depends on the system curve, dampers, the share of resistance unrelated to flow, fan, motor and VFD efficiencies, and the hours spent at each operating point. Systems with minimum pressure or flow requirements, filtration systems and fans operating near unstable regions require particular care. AMCA Publication 201-23, Fans and Systems discusses how installation conditions affect actual fan performance; it does not justify promising particular savings without analyzing the system.
Example: calculating savings across three operating conditions
Assume the fan operates for 4,000 hours per year. In the existing system, the motor runs at constant speed and a damper controls airflow. For each operating condition, assume the same required airflow before and after the change and the following electrical input powers. These figures illustrate the method; they are not a forecast for a particular site.
| Demand level | Time [h/year] | Current [kW] | After upgrade [kW] | Energy difference [kWh/year] |
|---|---|---|---|---|
| High | 1 800 | 24 | 25 | −1 800 |
| Medium | 1 400 | 22 | 15 | 9 800 |
| Low | 800 | 20 | 11 | 7 200 |
| Total | 4 000 | — | — | 15 200 |
Energy use before the upgrade: (1,800 × 24) + (1,400 × 22) + (800 × 20) = 90,000 kWh/year. After the upgrade: (1,800 × 25) + (1,400 × 15) + (800 × 11) = 74,800 kWh/year. The difference is 15,200 kWh/year, or approximately 16.9% of the energy used by the drive being analyzed.
In this example, the system with the VFD draws as much as 1 kW more at high load. Savings during longer periods of reduced demand only then outweigh that penalty. This is why neither the motor’s rated power nor the cube law alone provides a reliable business case. The financial value also depends on the company’s electricity cost, capital expenditure, servicing and the upgrade’s impact on other equipment.
Process constraints and drive selection
Minimum airflow must reflect the system’s purpose
In dust and gas extraction systems, reducing airflow can lower conveying velocity, impair contaminant capture or allow deposits to build up in ducts. Ventilation systems must maintain essential air exchange and the balance between supply and extract air. Changes to fire-safety, smoke-control or potentially explosive-atmosphere systems must not be based on a simple savings calculation: the documentation, overall solution compliance and safety requirements all need to be checked.
The VFD, motor and fan must be compatible
Electrical checks include the motor type, voltage, rated current, permissible speed range, cooling method, load and compatibility with the VFD. A motor cooled by a fan mounted on its own shaft may dissipate heat less effectively at low speed. Also check motor cable length, electromagnetic compatibility, insulation, the need for output filters and protective devices.
Mechanical limits involve vibration, resonance, bearings, belt drives and the impeller’s stable operating range. Certain speed bands may need to be excluded from the control settings. Detailed electrical requirements belong in the drive design and the documentation for the specific motor and VFD, not in a universal selection table based solely on kW rating. Examples of fan-specific features appear in Danfoss application documentation.
Control design and commissioning
A VFD can receive its setpoint manually, from a schedule, a process controller or a measurement-based regulator. Depending on the application, the controlled variable may be airflow, duct pressure, temperature or another parameter genuinely linked to demand. The sensor must be located where its reading reflects the required system condition rather than a local disturbance.
For PID control, settings must suit the process dynamics and avoid excessive oscillation. Define minimum and maximum allowable speeds, acceleration ramps, start and stop conditions, signal priorities, alarms and the response to loss of the measurement signal. We discuss integration with a wider building system separately in our article on HVAC automation.
Acceptance testing should confirm more than the motor’s ability to change speed. It should also include airflow and input-power measurements at several operating points, motor and drive temperature checks, vibration and noise measurements, alarm tests and a safe response to signal loss. If the system supplies several zones or works with heat recovery, assess how changes in airflow affect its other functions as well.
How can savings be verified after an upgrade?
Ideally, measure electricity use at the input to the entire drive so that VFD losses are included. Record airflow, pressure, speed, damper position and the process signal at the same time. Use instruments suited to the power supply and the quantities being measured.
A valid comparison requires similar operating conditions or adjustments for material variables such as production output, building use, filter fouling, temperature and operating schedule. The simplest condition-based energy balance adds the products of each power difference and its operating hours: energy saving [kWh/year] = sum of [(power before − power after) × hours in each condition]. This approach to measurement and verification is described in the NREL/U.S. DOE VFD evaluation protocol.
If the upgrade also changes airflow, operating hours, air quality or heating energy use, the result cannot be judged solely from the motor’s electricity meter. In systems that include heat recovery, the heat balance must also be assessed separately; our article on industrial heat recovery explains this in more detail. Only a comparison of the system’s overall function can establish whether the change benefits the site.
What to establish before buying a VFD
A sound decision requires answers to four questions: does airflow demand really vary, is air currently throttled or supplied in excess, can speed be reduced safely, and how will the result be measured? If data are lacking, a short period of recording power and process parameters is a better first step than choosing a VFD from a catalogue.
If you are considering a fan upgrade, describe the current control method, approximate operating hours and required airflow. You can send available curves, motor data and measurements of power, airflow and pressure via the Energy Trend contact form. This will help establish what else is needed to assess the options and next steps.
Frequently asked questions
Can every fan be connected to a VFD?
No. Check the motor type and documentation, permissible speed range, cooling, fan characteristics and safety function. A fan with an integrated EC drive requires the approach specified by its manufacturer.
Can a fixed minimum frequency of 20 Hz be used?
There is no single safe minimum frequency for every system. The limit depends on required airflow, aerodynamic stability, motor cooling, vibration and process conditions. It must be verified for the particular fan-and-drive assembly.
Will a VFD alone lower the electricity bill if the fan always runs at full capacity?
Not necessarily. With similar output and operating hours, the VFD’s additional losses may exceed any benefit. Other options should then be compared, including a better-matched fan, lower system resistance or a revised operating schedule.
Technical sources
- U.S. Department of Energy and AMCA, Improving Fan System Performance: A Sourcebook for Industry — fan curves, speed control and a system-wide approach.
- AMCA, Publication 201-23: Fans and Systems — the effects of installation conditions and system effects on fan performance.
- NREL/U.S. DOE, Variable Frequency Drive Evaluation Protocol — measuring and verifying savings.
- Danfoss, AC Drives for Fans — examples of control features and application limits.