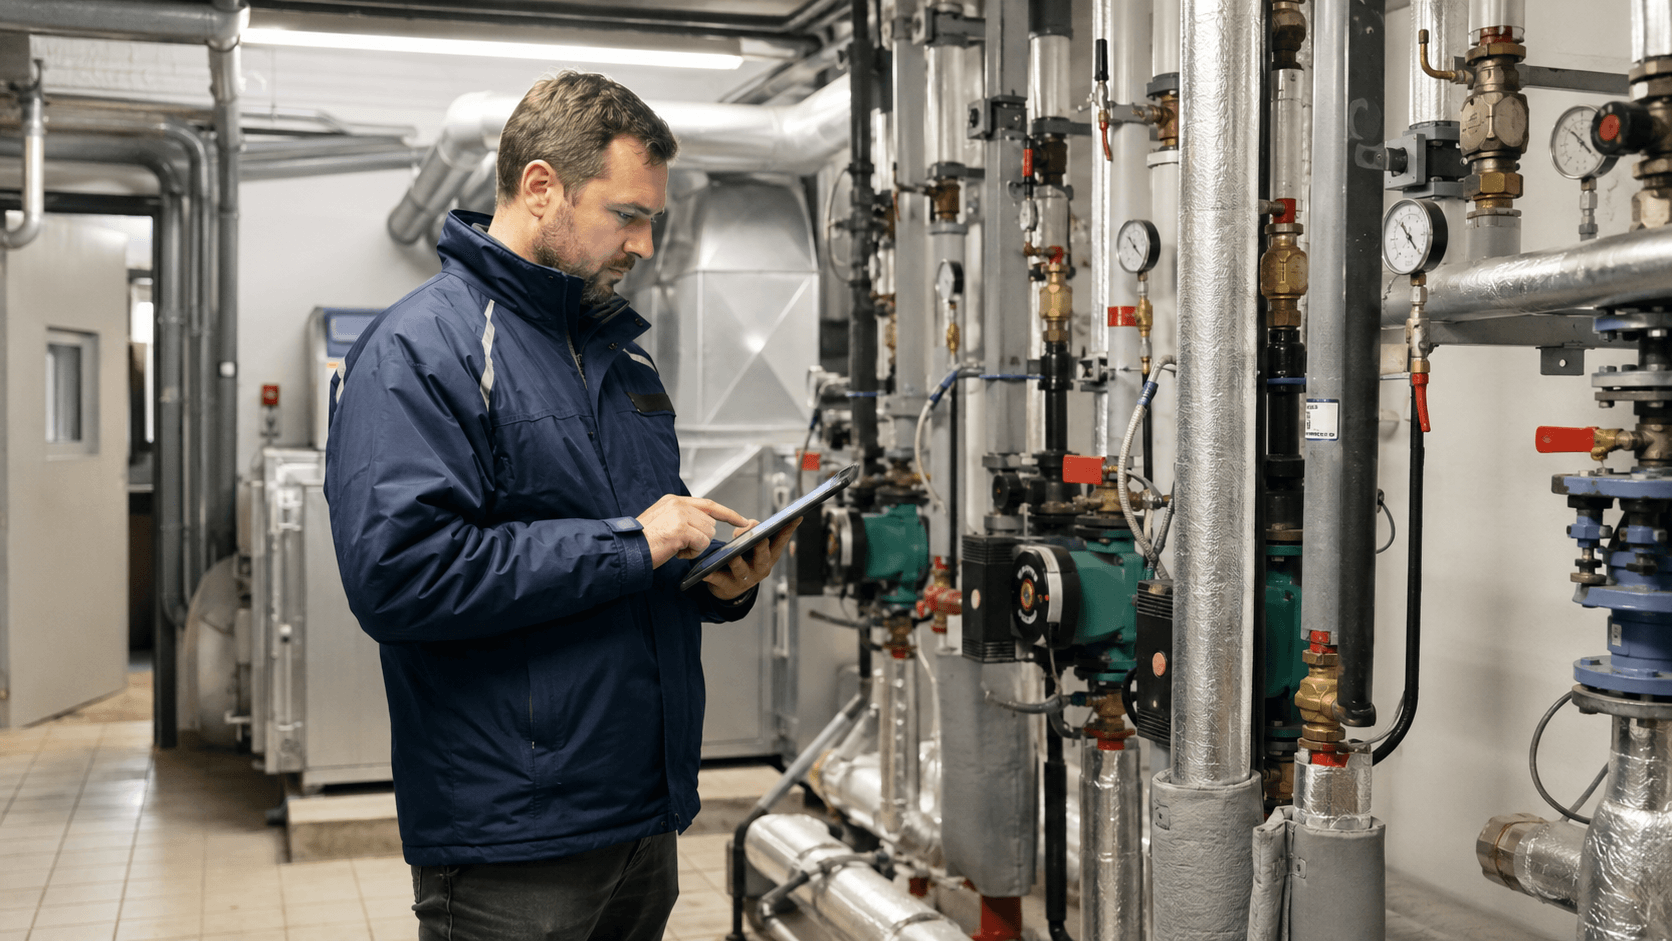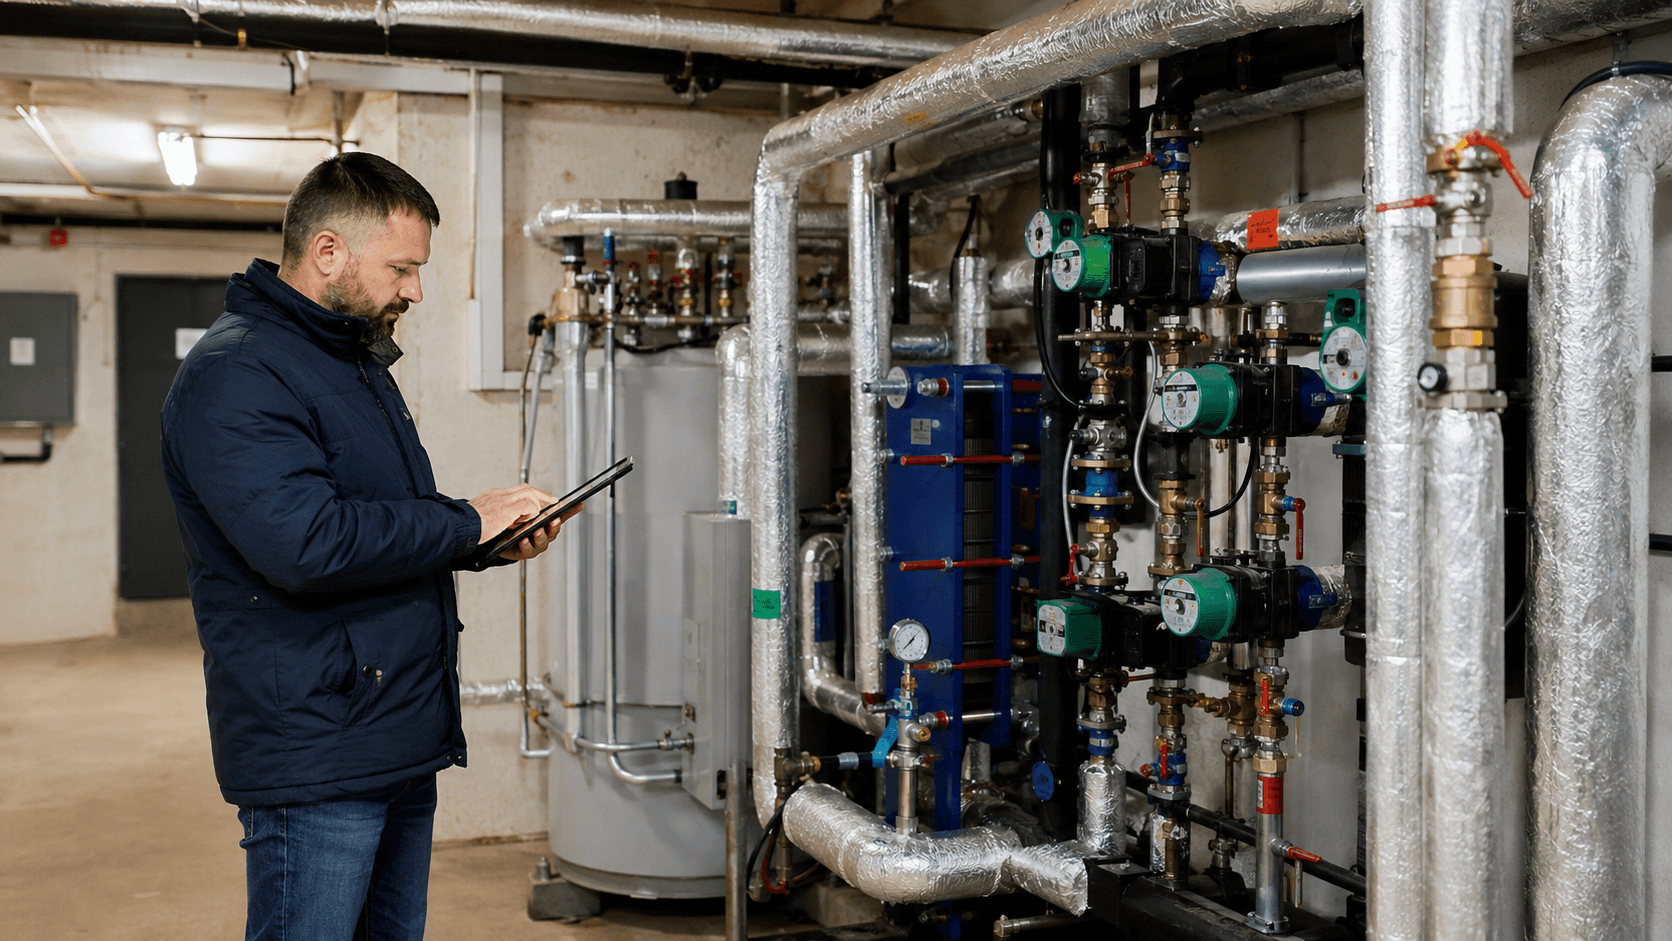
Energy efficiency in a company is not simply about replacing equipment with higher-efficiency models. A manufacturing plant operates as one system: the process determines energy demand, utilities are there to meet it, systems distribute energy to end-use equipment, while automation and operating practices determine whether energy is consumed only when needed and only in the amount required.
This is why losses do not always arise in the equipment that consumes the most energy. A compressor may be efficient while the system operates at excessive pressure. A motor may have a high efficiency class but drive a pump controlled by throttling. A refrigeration unit may be modern and still consume too much energy because of an unnecessarily low evaporating temperature, a fouled condenser or an incorrect compressor sequencing strategy.
In practice, improving energy efficiency primarily means achieving the same useful output with lower energy consumption, or increasing the output without a proportional increase in consumption. For this reason, the reference point should not be the energy bill alone, but also production output, operating time, load, ambient conditions and process parameters.
A system-based approach is consistent with the logic of ISO 50001:2018, which bases energy management on continual improvement in energy performance, and ISO 50006:2023, which develops the use of energy performance indicators and energy baselines. In turn, ISO 50002-3:2025 applies energy auditing directly to processes and their system-level energy balancing.
The plant as an energy system – where should you really look for losses?
Energy entering a company usually passes through several successive stages: it is purchased, converted, distributed and used in the process, while part of its potential is lost or discharged to the environment. For this reason, analysing a single piece of equipment without its technological context can lead to incorrect conclusions.
The most useful approach is to divide the analysis into four levels:
- Process demand – does the process genuinely require this temperature, pressure, flow rate, speed or operating time?
- Utility generation and distribution – how efficiently are compressed air, cooling, heat, steam, water or ventilation air generated and delivered?
- Control and operating practices – do devices respond to actual demand, or do they maintain constant parameters regardless of production?
- Waste energy – can heat, cooling or process energy that is currently rejected be used elsewhere in the plant?
Only after structuring the analysis in this way is it worth asking which equipment should be replaced. In many plants, part of the potential can be captured earlier by changing setpoints and schedules, repairing leaks, sequencing equipment correctly, maintaining heat exchangers or switching off unnecessary loads.
If what you primarily need is the sequence of the entire improvement programme rather than a map of technical areas, we describe it separately in the article where to start when improving energy efficiency in a company. Here we focus on what should be checked technically in a plant and which signals should trigger deeper analysis.
Start with organisational and low-cost measures, then move on to investments
One of the more common mistakes is to start a project by selecting new equipment. If the actual load profile, operating point and process demand are unknown, equipment may be replaced with a more efficient unit that is still incorrectly sized.
Before making capital investments (CAPEX), it is therefore worth checking measures that often require, above all, knowledge, measurements and operating discipline:
- adjust temperatures, pressures, flow rates and operating schedules;
- eliminate idle operation and unnecessary standby mode;
- repair leaks and other points of leakage;
- clean heat exchangers, filters, condensers and heat-transfer surfaces;
- properly sequence multiple compressors, pumps, refrigeration units or boilers;
- adapt system operation to changes in production;
- restore automatic control where manual bypasses and overrides have been left in place;
- zone loads and switch them off outside periods of use;
- continuously track deviations in energy performance indicators.
This does not mean that every change in a setpoint is safe. Process parameters, product quality, occupational health and safety requirements, reliability and production reserve take priority. The point is to first establish the actual process requirements and only then design an energy-efficient way to meet them.
1. Production process – start with the useful output
The production process should be the reference point for the other installations. It determines how much cooling, heat, motion, compressed air or ventilation is genuinely required. If the process is unstable, has frequent downtime or produces defects that require reprocessing, energy consumption can increase without any increase in useful production.
It is worth checking:
- specific energy consumption, e.g. kWh/t, kWh/unit or kWh/batch;
- energy consumed during start-up, downtime, changeover and idle operation;
- cycle time and line output at different load levels;
- the relationship between consumption and product type, recipe, raw-material temperature and ambient conditions;
- the share of rejects, rework and reprocessing where these affect energy consumption.
Typical sources of loss: equipment running while waiting for material, excessively high process temperatures or pressures, unnecessary heating followed by cooling of the same medium, unnecessarily long process times, bottlenecks that force parts of the line to run without production, and unstable quality that leads to reprocessing.
Diagnostic question: for comparable products and production volumes, does specific energy consumption remain stable, or does it change without an obvious process-related reason?
If the answer is unknown, it is worth separating process energy consumption from utility consumption and analysing the line’s operating profile. A broader approach to this area is described on the page about energy efficiency of production lines.
2. Compressed air – the whole system matters, not only the compressor
Compressed air should be analysed from the compressor room all the way to the point of use. Compressor efficiency alone will not reveal losses from leaks, pressure drops, poor control or applications that use compressed air without a sound process justification. In its compressed-air guidance, the U.S. Department of Energy identifies areas such as reducing leaks, stabilising pressure, proper maintenance and limiting losses during condensate drainage as fundamental improvement opportunities.
It is worth checking:
- compressor power and energy consumption, together with operating hours;
- flow rate and – where the data are reliable – specific energy consumption, e.g. kWh/Nm³ (kilowatt-hours per normal cubic metre, under defined reference conditions);
- pressure at the compressors and at critical points in the system;
- the share of loaded, unloaded and stopped operation;
- air consumption during non-production periods;
- pressure drops across dryers, filters and the distribution network.
Typical sources of loss: leaks, excessive system pressure, so-called artificial demand caused by excessive pressure, poor sequencing of multiple compressors, significant pressure drops, compressor operation outside the efficient range, and the use of compressed air where another utility or an electrical device would be sufficient.
Diagnostic question: after production stops, do compressor-room flow and power demand drop noticeably, or does the system continue to consume a significant amount of energy?
If the issue goes beyond individual leaks, the entire system needs to be analysed. We describe the scope of such work on the compressed air system audit page.
3. Motors and drives – an efficient motor can operate in an inefficient system
A motor should not be assessed only by its rated power or efficiency class. What matters is what it drives, the load at which it operates and how the process is controlled. Pump and fan systems are particularly important because their flow demand is often variable.
It is worth checking:
- actual input power and load profile rather than nameplate power alone;
- operating time and the number of hours at partial load;
- required process flow, pressure, speed or torque;
- control method: damper, throttling valve, bypass, on/off control or speed control;
- motor efficiency and, separately, the efficiency of the driven machine and the overall system.
Typical sources of loss: oversizing, throttling flow at constant speed, pumps or fans operating away from the correct operating point, worn gearboxes and mechanical components, incorrect belt tension, poor sequencing of parallel equipment and drives running when the process does not need them.
In its materials for pumping and motor systems, the Department of Energy consistently emphasises a systems approach and matching the pump and control method to the installation requirements, rather than optimising the component in isolation.
Diagnostic question: is pump or fan flow restricted by throttling or bypass while the motor operates at constant speed most of the time?
More information on drive selection itself is available on the electric motors and drives page.
4. Refrigeration and process cooling – use the smallest temperature difference required
In refrigeration, the entire cycle must be considered: the cooling load, evaporator, compressors, condenser, pumps, fans, defrosting and controls. DOE Better Plants emphasises that a systems approach is more effective in industrial refrigeration than analysing individual components, and identifies measures such as reducing unnecessarily high condensing pressure and properly sequencing compressors and condensers.
It is worth checking:
- energy consumption relative to the amount of product or cooling delivered;
- coefficient of performance (COP), where it can be determined reliably for the relevant conditions;
- evaporating and condensing temperatures or pressures;
- the temperature of the cooled medium and the temperature actually required by the process;
- compressor operation at partial load and the sequencing strategy;
- defrosting hours and control logic;
- the condition of heat exchangers, condensers, filters and insulation.
Typical sources of loss: maintaining a lower temperature than the process requires, an excessive difference between evaporating and condensing temperatures, fouled heat exchangers, suboptimal compressor sequencing, excessive defrosting, heat ingress through open gates and doors, incorrect flow rates and failure to use favourable ambient conditions where free cooling is possible.
Diagnostic question: is the cooling temperature level based on the actual requirements of the process and product, or mainly on a historical setpoint?
The technical details are best left to a separate analysis of refrigeration and the cooling process.
5. Heat, steam and process heating – energy should be supplied at the right temperature level
In thermal systems, losses are not determined solely by boiler or furnace efficiency. Generation temperature, transport, insulation, combustion parameters, the condition of heat-transfer surfaces, condensate, steam traps, burner operation and actual process demand all matter. DOE guidance for process heating highlights, among other measures, controlling the air-to-fuel ratio, keeping heat-transfer surfaces clean, limiting air infiltration and radiation losses, and using waste heat.
It is worth checking:
- fuel or heat consumption per unit of product;
- flue-gas temperature and – where appropriate for the heat source – combustion parameters;
- supply and return temperatures and the stability of heat demand;
- steam pressure and the actual requirements at points of use;
- condensate return, steam-trap condition and losses from discharges;
- heat-source operating time and the number of frequent starts and stops;
- the surface temperature of pipes, valves and equipment as an indication of missing insulation.
Typical sources of loss: excessively high temperatures or pressures, excess combustion air, fouled heat-transfer surfaces, uninsulated components, steam leaks, faulty steam traps, excessive blowdown or discharge, a low condensate return rate and frequent operation of the heat source at very low load.
Diagnostic question: is heat generated and distributed at a higher temperature or pressure level than is actually required by the most demanding end use?
If the issue mainly concerns how heat is generated, the next step is an analysis of the heat source and its modernisation options.
6. Energy recovery – a waste-energy source must be matched with a suitable end use
Waste heat may be present in flue gases, exhaust air, cooling water, compressor oil, products, process wastewater or refrigeration condensers. The mere presence of a high temperature does not, however, mean that a heat-recovery project will be justified.
It is worth checking:
- the temperature and flow rate of the waste-heat source;
- the availability of the source over the day, week and year;
- the demand of the potential end use over the same periods;
- the temperature required by the end use;
- the distance between the source and the end use;
- process variability, the possibility of buffering, and the effects of fouling and corrosion.
Typical sources of loss: rejecting heat to the atmosphere or a cooling system, no matching end use operating at the same time, excessive distance between the source and the end use, missing insulation and fouled heat exchangers. In practice, it is not only the instantaneous potential in kW that matters, but above all the annual amount of energy that can actually be recovered and used.
Diagnostic question: do the waste-heat source and the potential end use operate simultaneously for a sufficiently large part of the year?
A broader assessment method is described in our material on heat recovery.
7. Lighting – more than just luminaire power
In modern plants, replacing light sources alone often does not exhaust the potential. Even an LED installation can be inefficient if it is oversized, operates in empty zones or fails to use daylight.
It is worth checking:
- installed power and annual operating hours;
- lighting energy consumption, if separately metered;
- specific power in W/m² as a supporting indicator;
- required and measured illuminance in specific zones;
- shift schedule, occupancy and daylight availability;
- control method, zoning, occupancy sensors and dimming.
Typical sources of loss: excessively high illuminance, lighting unused parts of a hall or warehouse at the same time as occupied areas, lack of zoning, no occupancy-based control, dirty luminaires and schedules that do not reflect actual use of the facility.
Diagnostic question: does the lighting operate only where and when it is needed, and does the achieved level match the function of each zone?
Luminaire replacement, controls and modernisation options are discussed in more detail in the article on lighting modernisation.
8. Buildings and auxiliary infrastructure – losses independent of production
In industrial plants, the building is not always the largest energy user, but it can account for energy use that is independent of production volume. This includes heating, ventilation, air conditioning, gates, air curtains, offices and staff facilities.
It is worth checking:
- heating and cooling energy relative to floor area, taking weather conditions into account;
- heating, ventilation and air-conditioning (HVAC) schedules relative to occupancy and production shifts;
- setpoint and actual temperatures in different zones;
- ventilation flow rates and how well they match process and occupancy needs;
- the frequency of gate opening and visible air-infiltration paths;
- the condition of insulation, the building envelope and areas of elevated heat transfer.
Typical sources of loss: overheating and overcooling spaces, ventilation running outside occupancy hours, simultaneous heating and cooling, leaky gates and doors, thermal bridges, uninsulated installations and lack of zoning.
Diagnostic question: does building energy consumption change logically with weather, occupancy time and production, or does it remain high even when the facility is used only lightly?
If losses through the building envelope and building services dominate, the topic should be developed further as part of a building energy audit.
9. Automation and control – an algorithm can save energy or create losses
Automation does not guarantee efficiency by itself. A controller can maintain a parameter very precisely even when that parameter has been set incorrectly. For this reason, an audit should look not only at the presence of building management systems (BMS), programmable logic controllers (PLC) or variable-speed drives, but above all at their control logic.
It is worth checking:
- trends in setpoint and actual values;
- valve and damper positions and variable-speed-drive control signals;
- equipment operating hours and start-up sequence;
- the number of alarms, manual overrides and control bypasses;
- the quality and reliability of temperature, pressure and flow sensors;
- cases of simultaneous heating and cooling or several sources operating at low demand.
Typical sources of loss: fixed setpoints independent of production, drifting sensors, manual modes left active, incorrect hysteresis, excessively frequent equipment cycling, poor sequence priorities and control loops that effectively “fight” each other.
Diagnostic question: does the control system actually follow process demand, or does it mainly maintain historical setpoints?
Automation creates the most value when it is combined with good data and clear energy performance indicators.
10. Energy monitoring and management – data must lead to action
The main energy meter tells you how much the whole plant consumed, but usually does not answer the question of why consumption changed. Effective management requires data at a level that makes it possible to separate the process, utilities and base load and relate them to the factors that influence performance.
It is worth checking:
- power and energy profiles at 15-minute intervals or another resolution appropriate to the process;
- base load outside production;
- submeters for major processes and utility systems;
- energy performance indicators (EnPIs), e.g. kWh/t, kWh/unit, kWh/Nm³ or another indicator appropriate to the process;
- an energy baseline that accounts for relevant variables such as production, weather, operating hours or product mix;
- data completeness, metering errors and communication outages;
- deviation-response rules: who receives an alert and what they do next.
ISO 50006:2023 specifically emphasises establishing, using and maintaining energy performance indicators and energy baselines. A dashboard without a response process does not, however, improve efficiency.
Typical sources of loss: no breakdown of consumption by area, no data normalisation, analysing monthly bills only, alerts without assigned responsibility, no control of consumption during weekends and shutdowns, and deviations persisting for months without anyone explaining them.
Diagnostic question: can the company explain why it used more energy yesterday than on a comparable day, identifying a specific process or a change in conditions?
This area is developed further on the energy monitoring and management page.
The greatest potential often lies between systems
Analysing each area separately is necessary, but the most interesting findings often emerge only when the data are combined. A few examples:
- process and refrigeration: lowering the process temperature by additional degrees may increase the refrigeration load without improving product quality;
- compressed air and production: increasing pressure across the entire network because of one problematic end-use application increases the compressed-air demand of all other end uses;
- refrigeration and heat: energy rejected at the condenser can be a potential heat source, but only if there is a suitable heat user and the demand coincides in time;
- drives and automation: a variable-speed drive provides a means of regulation, but the benefit appears only when the control algorithm uses that capability in line with actual demand;
- building and process: process ventilation may cause a large inflow of outdoor air that must subsequently be heated or cooled;
- monitoring and maintenance: a sudden increase in consumption may be the first sign of a fouled heat exchanger, a leak, a changed setpoint or deteriorating equipment performance.
This is why a good energy analysis does not end with a list of “compressor – motor – lighting”. It should show cause-and-effect relationships between the process and utilities.
A simple example: how much can unnoticed base-load consumption cost?
Assume, purely as an example, that after production ends measurements show a constant demand of 90 kW, while equipment analysis indicates that 35 kW of this value is unnecessary for 12 hours per day on 250 days per year.
The annual energy associated with this unnecessary demand can be estimated as follows:
35 kW × 12 h/day × 250 days = 105 000 kWh/year = 105 MWh/year.
This is not a result for any specific company or a guaranteed saving. The example does, however, show why the power profile should be analysed before purchasing new technology. Unnecessary demand may be distributed across fans, pumps, compressed air, HVAC, electric heating, lighting and equipment left idling.
How do you decide whether an area requires deeper analysis?
There is no single system that always offers the greatest savings. Its importance depends on the production technology, operating time, equipment condition, utility costs and control method. Areas are particularly suitable for further analysis where at least one of the following signals is present:
- they account for a significant share of the plant’s energy balance;
- specific consumption changes despite similar production;
- equipment runs for long periods beyond actual demand;
- there is a constant load during shutdowns or at weekends;
- setpoints have no documented process justification;
- the system is controlled mainly manually or by throttling and bypasses;
- metering data are too general to identify the cause of a deviation;
- a major equipment replacement is planned, but load profiles have not been measured;
- a significant amount of waste heat is generated without potential end uses having been assessed.
If the issue concerns the entire plant and an energy balance and list of areas need to be developed, an appropriate tool may be a company energy audit. Where a specific measure and its energy impact are being analysed, the scope may be closer to an energy efficiency audit. The type of analysis should be selected based on the decision the company needs to make, not on the name of the audit itself.
Which indicators are worth monitoring continuously?
Indicators should be as closely linked as possible to useful output. Monthly MWh alone provides too little information if production changes by tens of percent. In practice, a basic set may include:
| Indicator | What it helps identify |
|---|---|
| kWh/t, kWh/unit or kWh/batch | changes in the energy intensity of production |
| base load outside production | loads operating without useful output |
| kWh/Nm³ of compressed air | changes in utility-generation efficiency, where flow is measured reliably |
| COP or kWh per unit of cooling/product | changes in refrigeration performance under comparable conditions |
| fuel or heat per unit of product | changes in the efficiency of thermal processes |
| building energy after weather normalisation | weather-independent deviations in HVAC and the building envelope |
| EnPI relative to the baseline | persistent deviations after relevant variables have been taken into account |
Most importantly, an indicator should be repeatable, understandable and based on data of known quality. If the product mix, weather or number of shifts changes, a simple ratio may require normalisation. For this reason, the baseline should be updated only when there is a substantive justification, not in order to “improve” the result.
FAQ – energy efficiency in a company
Does reducing energy costs always mean improving energy efficiency?
No. Changing the tariff, the energy purchase price or contracted capacity can reduce cost without reducing the energy consumed per unit of useful output. These are important cost-management measures, but technical efficiency should be assessed separately. This allows the company to know whether it is saving because of commercial terms or because of a genuine change in the process and installations.
Is replacing old equipment with new equipment the best first step?
Not always. First, it is worth knowing the load profile, required operating point and control method. New equipment selected for an incorrect demand can still operate inefficiently. In many cases, part of the potential can be captured through setpoints, schedules, repairs, sequencing and automation.
Which indicator best shows an improvement in energy efficiency?
There is no single universal indicator. For production it may be kWh/t or kWh/unit, for compressed air kWh/Nm³, and for a building a result adjusted for weather and occupancy time. A larger plant needs a set of several EnPIs linked to its most significant energy uses.
Should every identified energy-saving opportunity be implemented?
No. Once the technical potential has been identified, its impact on the process, quality, safety, reliability and economics must be assessed. Particularly in heat recovery, changes in temperatures or pressures and upgrades to critical systems, the theoretical potential may be greater than the effect that can be achieved in actual operation.
Summary
A company’s energy efficiency is the result of how the entire system operates. First, the process requirements must be established; then the generation and distribution of utilities, operation of end-use equipment, automation, base load and the potential for energy recovery should be assessed. Only on this basis can investment decisions be made rationally.
The biggest mistake is to treat modernisation as a list of independent purchases. A new compressor, motor, refrigeration unit or luminaire may have high catalogue efficiency, but the result for the whole plant depends on how the equipment operates in the actual process.
If the objective is to determine where losses occur in a plant and which of them are worth calculating in greater detail, a good starting point is an energy balance combined with measurements and production data. This makes it possible to separate organisational and low-cost measures from projects that genuinely require investment, engineering design or a detailed audit.
Sources and standards used in this article
- ISO 50001:2018 – Energy management systems – a systems approach to energy performance and continual improvement.
- ISO 50006:2023 – Energy performance indicators and energy baselines – EnPIs, baselines, measurement and monitoring of energy performance.
- ISO 50002-3:2025 – Energy audits in processes – current guidance on process energy audits.
- European Commission JRC – Energy Efficiency BREF – a horizontal approach to improving energy efficiency in industrial installations.
- U.S. Department of Energy – MEASUR – system-level assessment tools for pumps, fans, motors, compressed air, process heating, lighting and other systems.
- U.S. Department of Energy – Compressed Air Systems – assessment areas for compressed air systems.
- Better Buildings & Better Plants – Industrial Refrigeration – a systems approach to industrial refrigeration.
- U.S. Department of Energy – Process Heating Systems – improvement areas for process heating and heat recovery.