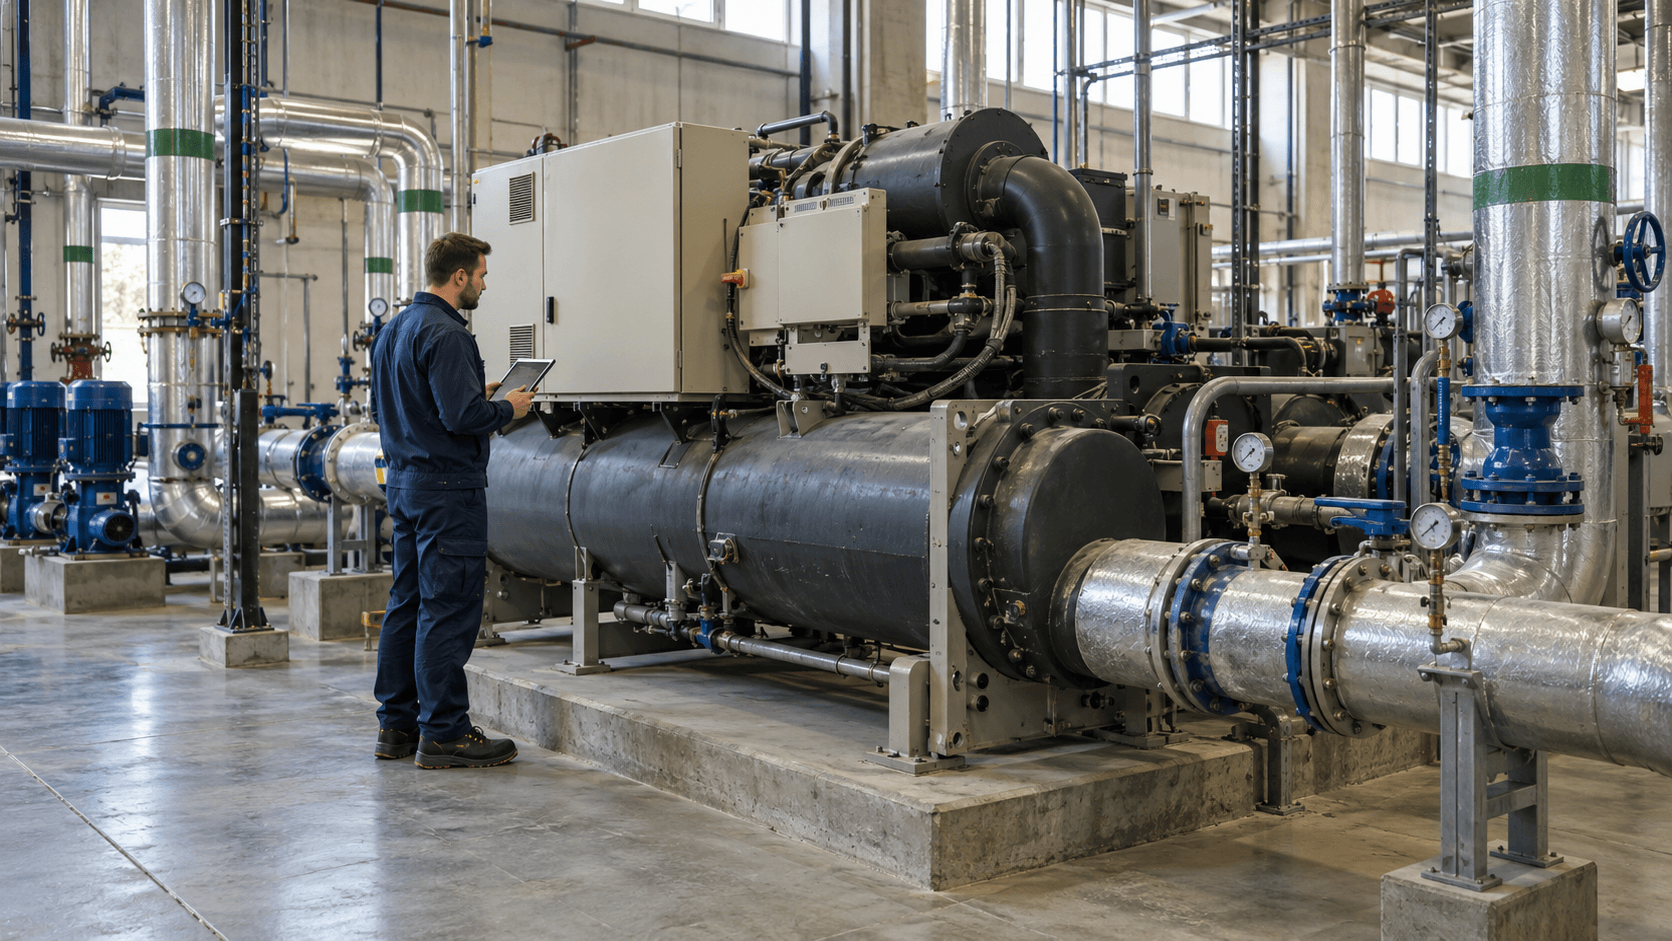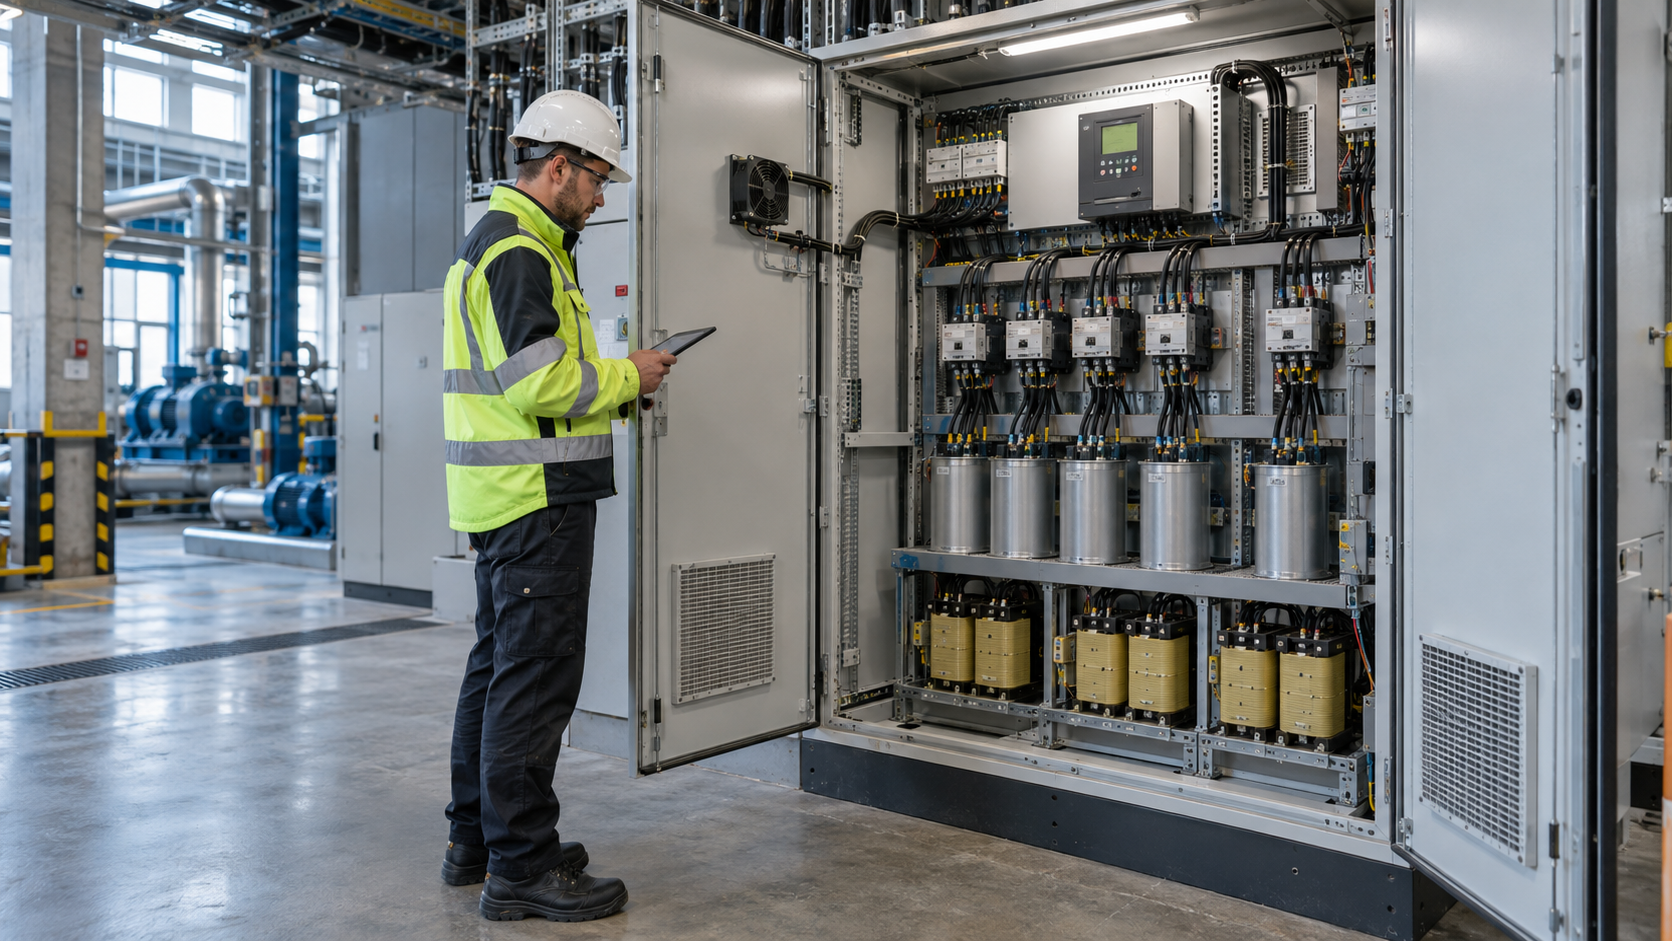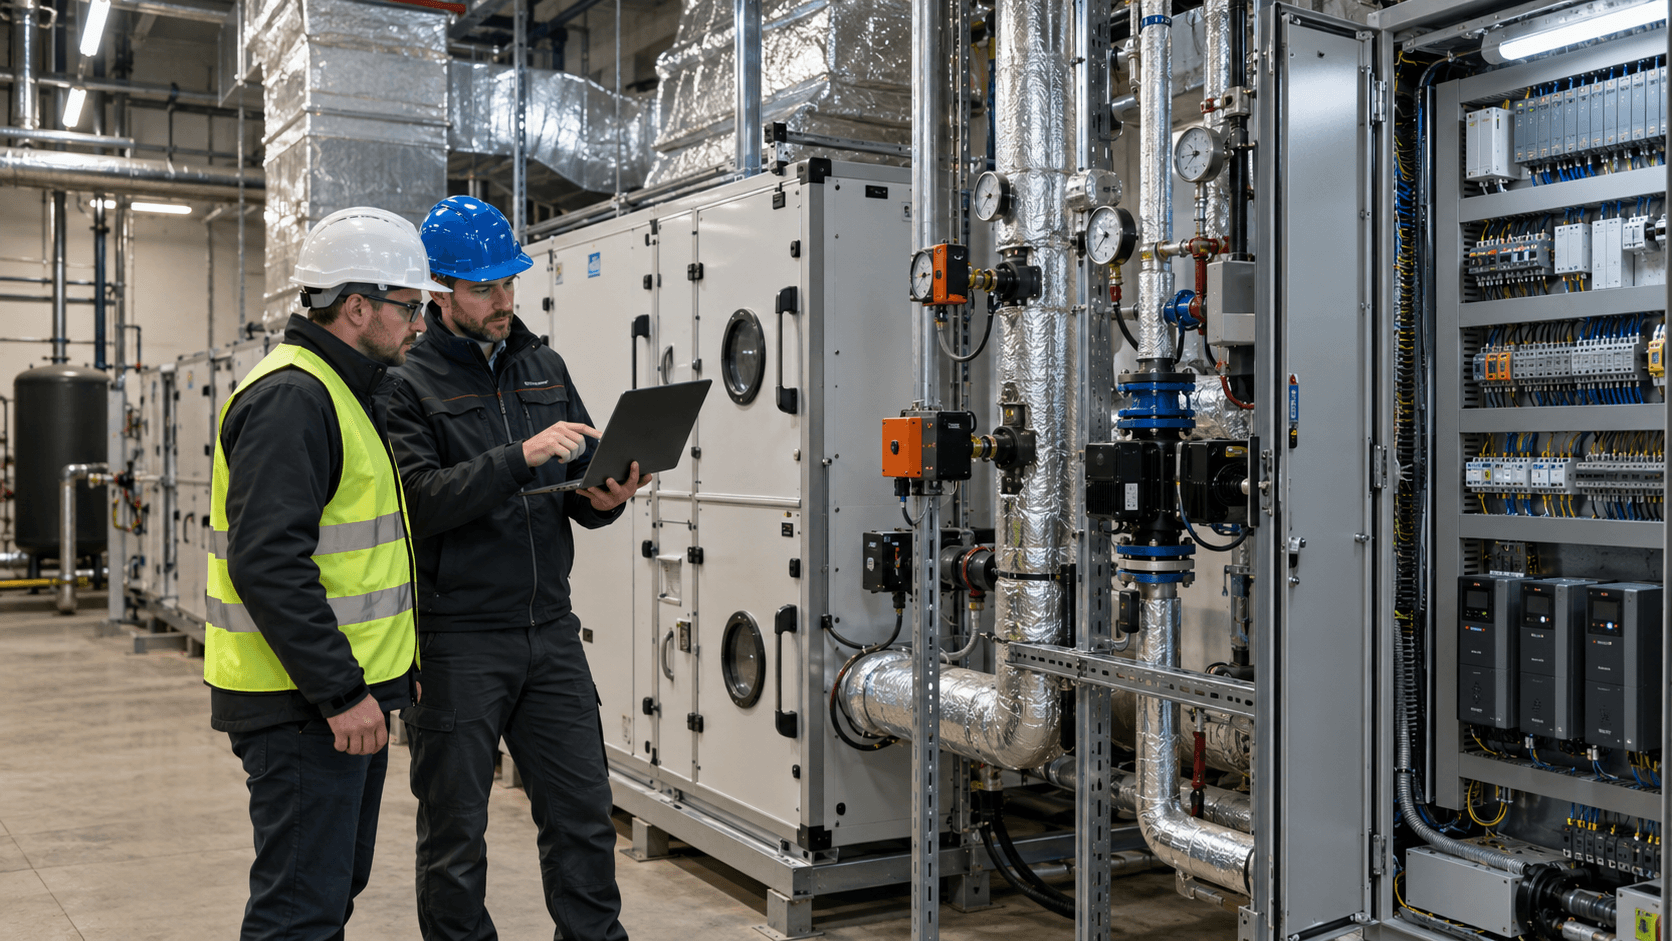
Automation can reduce energy consumption in a plant, but only when it changes how equipment operates in response to actual process demand. A PLC, SCADA screen or new variable-speed drive does not deliver savings on its own. The essentials are identifying unnecessary running time, defining safe conditions for changing setpoints and establishing how results will be measured.
How does automation affect energy consumption?
Equipment in a manufacturing plant may draw power even when it is doing no useful work: a conveyor runs during a break, a pump maintains excessive flow, a fan operates at constant output, or two compressors remain on standby despite low air demand. The purpose of energy-saving automation is to match equipment operation to the process—not to switch everything off at any cost.
In practice, control systems can improve energy performance in four ways:
- Reducing unloaded running time – switching to standby or a stopped state once defined conditions have been met.
- Matching output to demand – adjusting speed, flow or pressure instead of continuously operating at the maximum setpoint.
- Coordinating multiple units – selecting how many pumps, fans or compressors should run to meet current demand.
- Preventing unnecessary state changes – using suitable thresholds, hysteresis and minimum run times to avoid frequent switching.
For example, the US Better Plants guidance on pumping systems identifies shutting down unnecessary pumps, running the minimum number of units needed and controlling speed rather than throttling as ways to improve efficiency. This does not mean every system fitted with a variable-speed drive will save energy: the installation characteristics, drive efficiency and load profile determine the outcome.
Monitoring measures and explains consumption; automation changes how a system operates. The two can work together, but they are not the same thing. We discuss measurement points and indicators in more detail in our article on energy monitoring in businesses.
Where can control systems reduce energy losses?
Systems with demand that varies over time are the best starting point. The motor’s rated power alone, however, tells us little. We need to establish which operating states occur, how much energy the equipment uses in each state and which states can be changed safely.
| System | Possible change in control logic | Condition to verify |
|---|---|---|
| Conveyor or auxiliary production-line equipment | Stop after material transfer is complete; restart only when the process requires it | Material buffer, startup sequence, risk of blockages and operator safety |
| Circulation and process pumps | Adjust the number and speed of pumps to flow or pressure demand | Minimum flow, cooling/seal requirements, operating point and system curve |
| Process fans | Adjust output or stop during operating states that do not require ventilation | Required air exchange, pollutant extraction and process requirements |
| Compressed air plant | Sequence compressors, reduce unloaded operation and adjust the pressure band | Minimum pressure at points of use, receiver capacity, demand dynamics and permitted duty cycles |
| Process cooling system | Adjust temperature setpoints, pump operation and equipment staging according to load | Product quality, temperature stability, process constraints and response time |
The type of equipment matters. For pumps and fans with variable demand, speed control is often worth investigating. With conveyor drives, the benefit may instead come from reducing unnecessary running time. The Australian Government’s guide to motors and variable-speed drives recommends considering time spent in different operating states and the efficiency of the complete motor-and-drive assembly when assessing performance.
Process requirements and safety first, savings second
Energy-saving control algorithms must respect process requirements, machine safety and operating limits. If a fan extracts hazardous fumes, stopping it on a timer may be unacceptable. If a pump cools equipment, delaying its startup can cause overheating, even when instantaneous power demand falls.
Before changing the program, agree at least the minimum and maximum process parameters, required run-on times, startup and shutdown sequences, fault responses and conditions for switching to manual control. Safety functions and energy-isolation procedures for maintenance must never be replaced by ordinary optimisation logic.
For a machine’s electrical equipment, IEC 60204-1:2016 with Amendment A1:2021 may be a relevant reference when assessing a proposed solution. It is a technical standard, not a legal provision that automatically determines the compliance of any particular machine. The applicable legal requirements, risk assessment and protective measures must be established for each installation.
What should happen if a signal is lost?
Suppose a controller reduces pump speed based on a flow measurement. If the signal disappears or becomes unreliable, the program must not interpret this as zero demand. Fault detection and a previously agreed response are needed: for example, maintaining a safe setpoint, switching to a backup mode or stopping if required by the risk assessment. No single response is correct for every process.
Which signals and setpoints are needed to control equipment?
Designing control logic starts with a signal map, not with choosing an operator panel. Command signals must be distinguished from actual equipment states: a ‘start’ command does not prove that a motor is running, and a ‘stop’ command does not confirm that energy consumption has ceased.
| Data group | Example signals | Purpose |
|---|---|---|
| Process state | Production / no production, buffer occupancy, flow, temperature, pressure, level | Indicate when the equipment is needed and which parameters it must maintain |
| Equipment state | Running, ready, fault, contactor feedback, speed, automatic/manual mode | Confirm command execution and support troubleshooting |
| Energy | Active power in kW, active energy in kWh, time spent in each operating state | Allow energy consumption to be calculated before and after the change |
| Limits and alarms | Minimum pressure, flow limit, overheating, safety signal, communication loss | Prevent unsafe optimisation and trigger the defined response procedure |
Measurement timestamps and event logs must also be synchronised. If an energy meter records readings every 15 minutes while switching events last only a few dozen seconds, that profile may not be detailed enough to assess an individual sequence. A measurement with suitable time resolution, or a power log correlated with controller states, is then needed.
Hysteresis, minimum run time and operator priority
With simple on/off control, a single threshold can cause equipment to cycle continuously. Hysteresis uses two thresholds, while limits on the number of starts and minimum stop times protect against excessive switching. The appropriate settings come from equipment documentation, process dynamics and commissioning tests—not a universal formula.
Manual mode should have clearly defined permissions and visible status indication. Operators must know whether disabling automatic optimisation restores normal operation, and the system should record such changes. Manual control must never bypass safety functions.
Example: reducing conveyor operation when no material is being transported
Consider a conveyor that runs empty between product batches. Measurements show an average active power draw of 2.4 kW from the grid in that state. After reviewing the process sequence, the team establishes that unloaded operation can safely be reduced by two hours per day over 220 days per year.
The preliminary, modelled reduction in energy use is:
2.4 kW × 2 h/day × 220 days/year = 1,056 kWh/year.
Assume also that the modified sequence causes one additional start per day. For the model, allow 0.08 kWh of additional energy for the entire startup sequence, above the energy already accounted for in the balance; at a real plant, this value would need to be measured. The resulting balance within the chosen measurement boundary is:
1,056 kWh/year − (0.08 kWh × 220) = 1,038.4 kWh/year.
This is an illustrative calculation, not the result of an Energy Trend project or a forecast for any particular plant. It excludes possible changes in the operation of adjacent machines, emergency starts, production losses and maintenance costs. These factors must be checked before a decision is made, along with whether the additional start is acceptable for the drive and process.
From an energy auditor’s perspective, the first question matters more than the kWh figure itself: does stopping the conveyor genuinely leave production unaffected? Only once that condition is confirmed do the savings have operational value.
How should the change and operation during downtime be tested?
Functional testing goes beyond checking whether equipment responds to a command. It should also confirm system behaviour in abnormal situations. For each new sequence, prepare a record of the initial condition, expected response, test result, approving person and measurement evidence.
- Normal operation: the equipment maintains the required process parameter at the actual load.
- Transition to standby: the equipment stops only when conditions are met, without losing material or compromising process parameters.
- Restart: the startup sequence, readiness of connected equipment and permitted response time are maintained.
- Signal failure: the system detects missing data or inconsistent signals and enters the agreed state.
- Manual mode and return to automatic: the active mode is visible to the operator, and switching modes does not cause an unintended start.
Periods without production also need separate observation: breaks, shift ends, weekends and waiting for material. A good test measures power demand across the entire installation, not merely the ‘equipment stopped’ signal. For example, automatically stopping one pump may cause a standby pump to start; in that case, a local reduction in power demand may not translate into savings for the whole system.
How can automation savings be separated from lower production?
Comparing bills or monthly energy consumption alone is not enough. Production volume, product mix, operating hours, outdoor temperatures or equipment condition may have changed alongside the control strategy. Results should be compared under conditions that are as similar as possible, or the differences must be accounted for in the calculations.
Two complementary indicators are useful: energy consumption by the equipment in comparable operating conditions and energy consumption relative to production output. In simple processes, comparing kWh per unit or tonne may suffice. Where there is substantial consumption unrelated to output, or several variables affect the result, a more appropriate baseline model is needed.
Why does a 3,900 kWh drop in consumption not necessarily mean 3,900 kWh in savings?
Suppose a plant consumed 30,000 kWh in one month and produced 20,000 units before the change. After the control change, consumption fell to 26,100 kWh, but output also fell to 18,000 units. The meter readings differ by 3,900 kWh, yet much of that difference may be attributable to lower production.
Under the simplifying assumption that consumption is proportional to the number of units, baseline energy intensity is 30,000 / 20,000 = 1.5 kWh/unit. At an output of 18,000 units, expected consumption without changing the controls would be 27,000 kWh. The difference from measured consumption after the change is 900 kWh, not 3,900 kWh.
This simplified calculation illustrates why normalisation matters, but it does not yet verify the investment’s impact. If fixed consumption is high, product mix varies or temperature affects energy use, a model based solely on unit count can give a misleading result. ISO 50006:2023 addresses energy performance indicators and baselines, while ISO 50015:2014 covers general principles for measuring and verifying energy performance. The method for a particular project should reflect the available data and required confidence in the results.
Implementation plan: from data to maintaining the settings
A controller change should be treated as a process modification with a clearly assigned owner even after acceptance. Otherwise, sound control logic may be disabled after the first production stoppage, leaving the plant unable to explain what happened to the expected benefit.
| Stage | Key outcome | Plant-side responsibility |
|---|---|---|
| 1. Assessment | Equipment and operating-state list, energy measurements, description of losses and process conditions | Energy manager, maintenance, production |
| 2. Control specification | Rules, interlocks, limits, fault responses and acceptance criteria | Process engineer and those responsible for safety |
| 3. Implementation | Program version, change log and ability to restore previous settings | Automation engineer and maintenance |
| 4. Tests and measurements | Test reports, trends in process parameters and energy use under comparable conditions | Production, automation engineer, energy manager |
| 5. Sustaining performance | Setpoint owner, alarm reviews, periodic indicator assessment and change-control rules | Area manager, maintenance, energy manager |
Responsibility for changing settings after commissioning must also be defined. If operators can adjust the pressure threshold themselves, the change history should be recorded and acceptable limits established. At a plant with an ISO 50001-compliant energy management system, these activities can be linked to the energy review, performance indicators and change control—but automation alone is not equivalent to implementing ISO 50001.
When is changing the automation not the first step?
Not every loss can be eliminated through controller software. If a compressed air system continually makes up for major leaks, adjusting the compressor sequence is no substitute for fixing the network. If a pump operates far from its efficient duty point, hydraulic changes or different equipment may also be necessary. If reliable measurements are missing, establish the baseline before investing in complex control logic.
For compressed air, pressure, points of use, unloaded operation, sequencing and leaks should be reviewed together. The Australian Government’s compressed air guide discusses compressor coordination as part of a whole-system approach, not merely a matter of controller settings.
Nor should we assume that ‘more automation’ always means ‘less energy’. Sometimes the right decision is to simplify the operating schedule, repair a sensor, change operating practices or adjust existing settings without buying a new system.
Where should you start in your plant?
First, choose one area with periods of operation without demand or marked load fluctuations. Then gather information about the process, equipment operating states, available power and energy trends, controller signals and required process constraints. A complete set of measurements is not necessary for an initial discussion.
If you would like to assess whether automation and energy consumption are a significant issue at your plant, describe your installation and send the data you have to audytor@energytrend.pl. This can help identify the additional measurements, tests and agreements needed before deciding on a control change.
Technical sources
- U.S. Department of Energy, Better Plants – Pumps – pump operation and matching output to demand.
- Australian Government – Motors and variable speed drives – assessment of drives and part-load performance.
- Australian Government – Compressed air – compressor control and coordinated operation.
- IEC 60204-1:2016+A1:2021 – safety of the electrical equipment of machines.
- ISO 50006:2023 – energy performance indicators and baselines.
- ISO 50015:2014 – measurement and verification of energy performance.